1
Comparison of the performance of the model with respect to the number of
teeth
Let us now give some details on
the IvisionLAB dataset composition, and show the performances our approach
can achieve on the test dataset.
1.1
Dataset
The DNS Panoramic images from
IvisionLAB [
2]
were used to train our Modified U-Net network. This dataset contains
images of size
annotated with the tooth numbering (FDI notation,
i.e. position
label) using the Coco format. The images can be divided into 8 categories
regarding the presence or absence of all teeth in images, of restorations
and appliances (interested readers might refer to [
2]
for a detailed description of different categories).
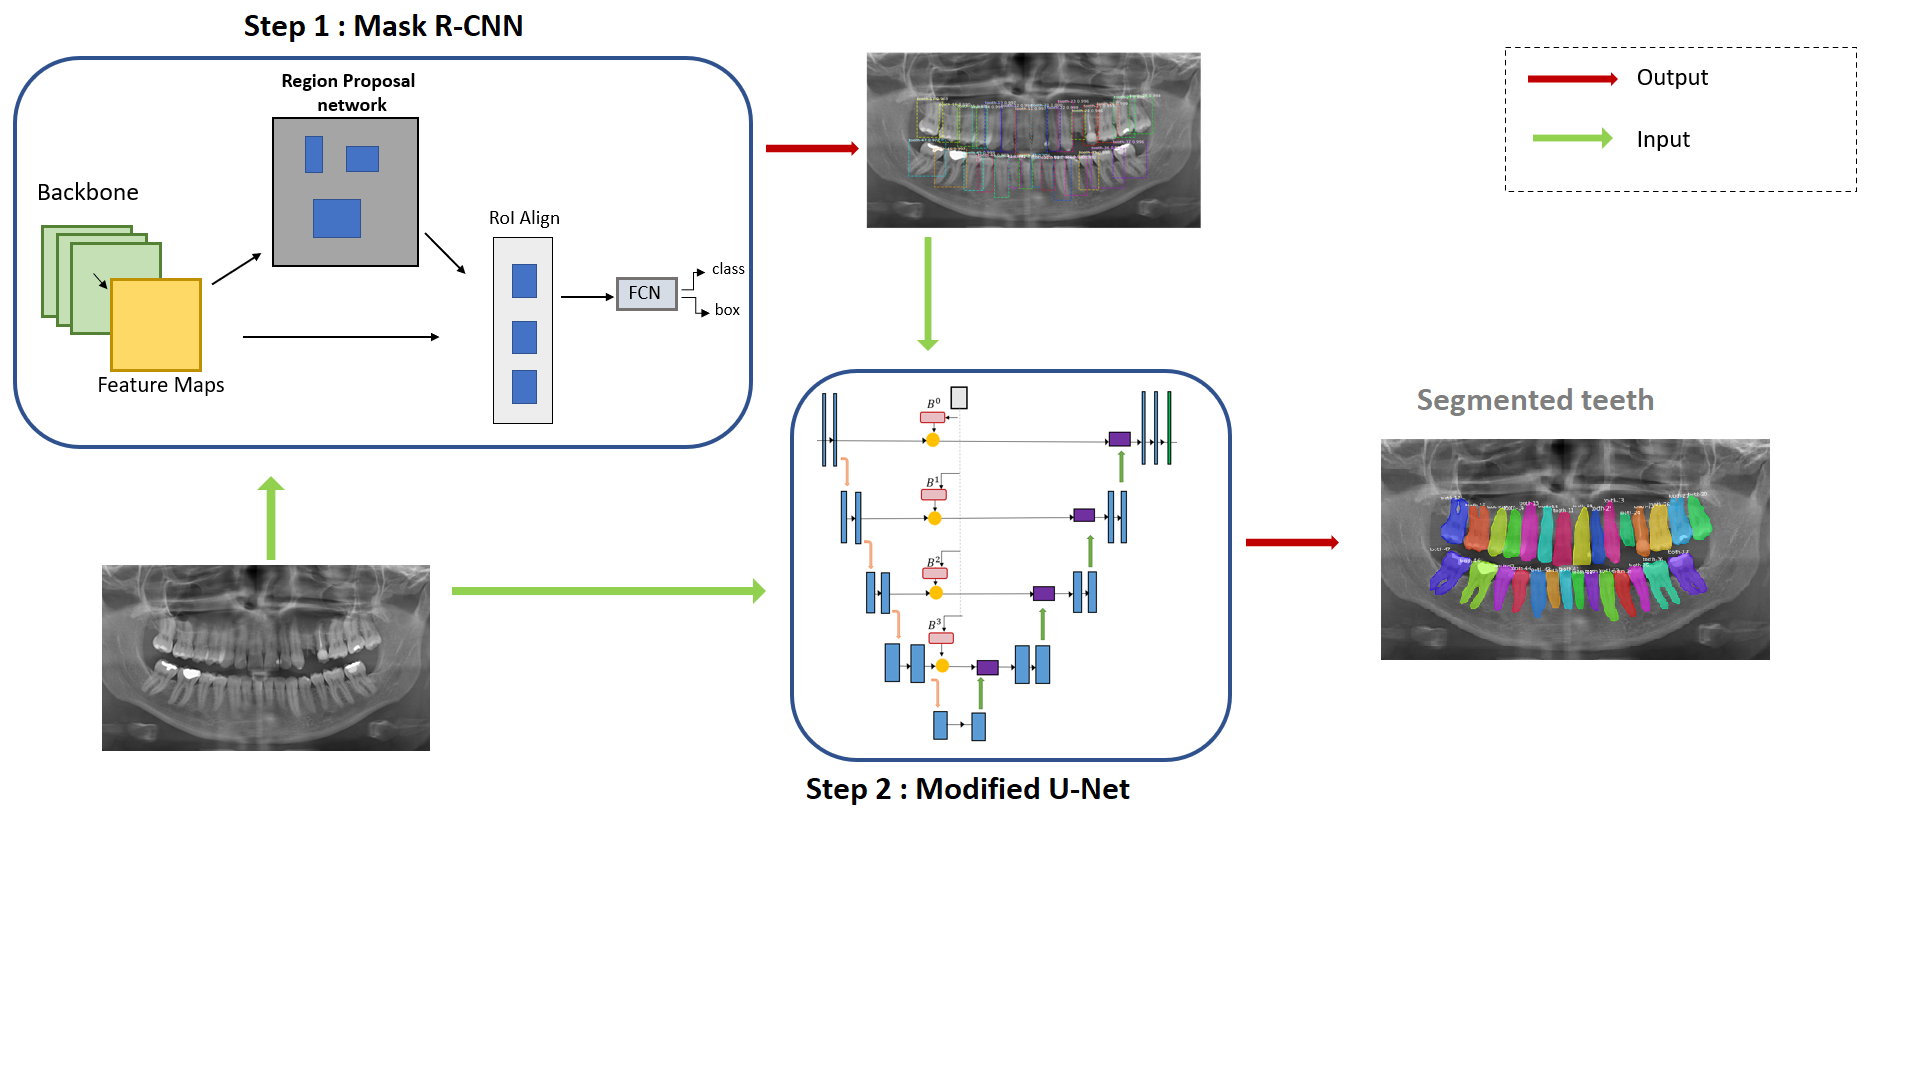
Mask R-CNN and U-Net models were
trained using a 4-fold cross validation. In total,
images were retained to build the
test set and the rest of the images were divided into 4 folds ( images each) thus composing the train
and validation data in a cross-validation fashion.
1.2
Results
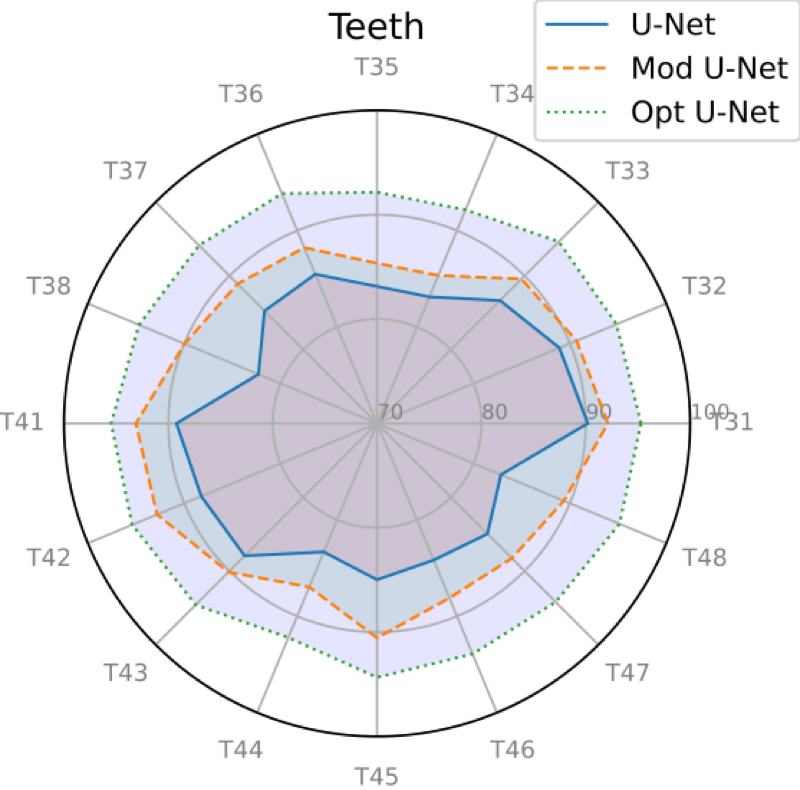
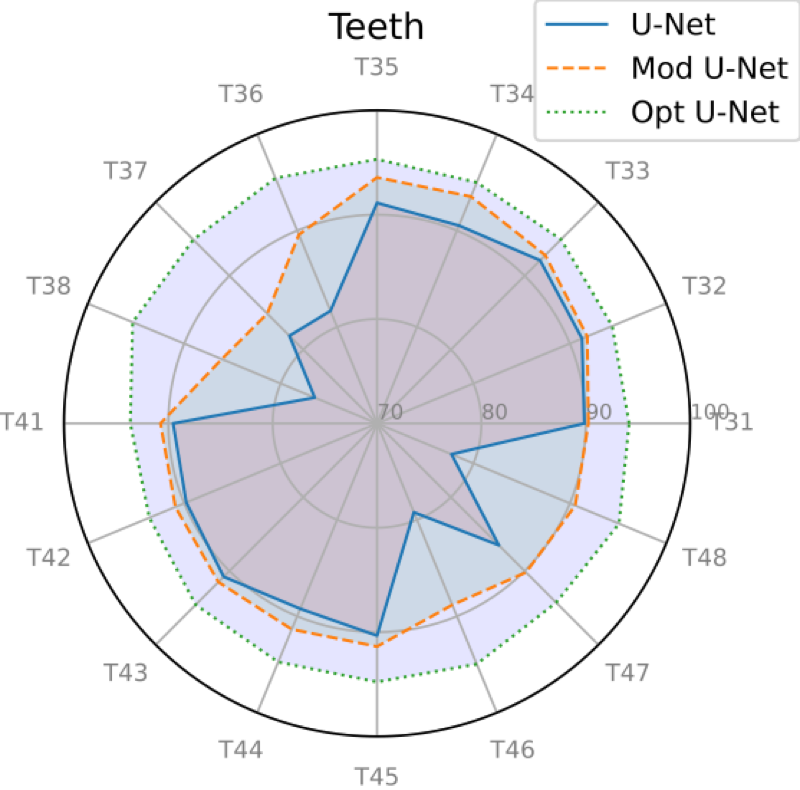
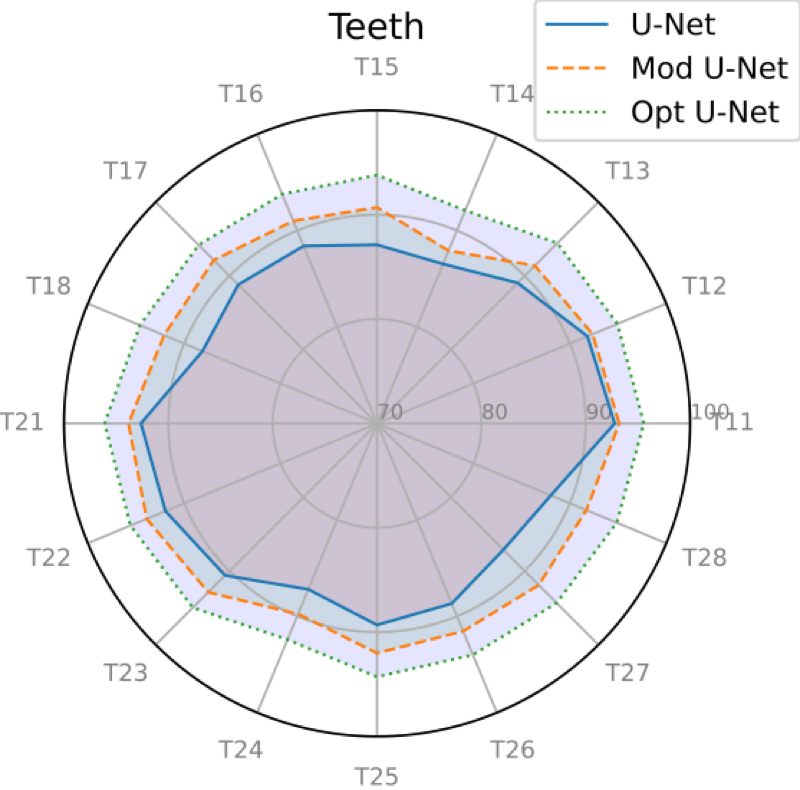
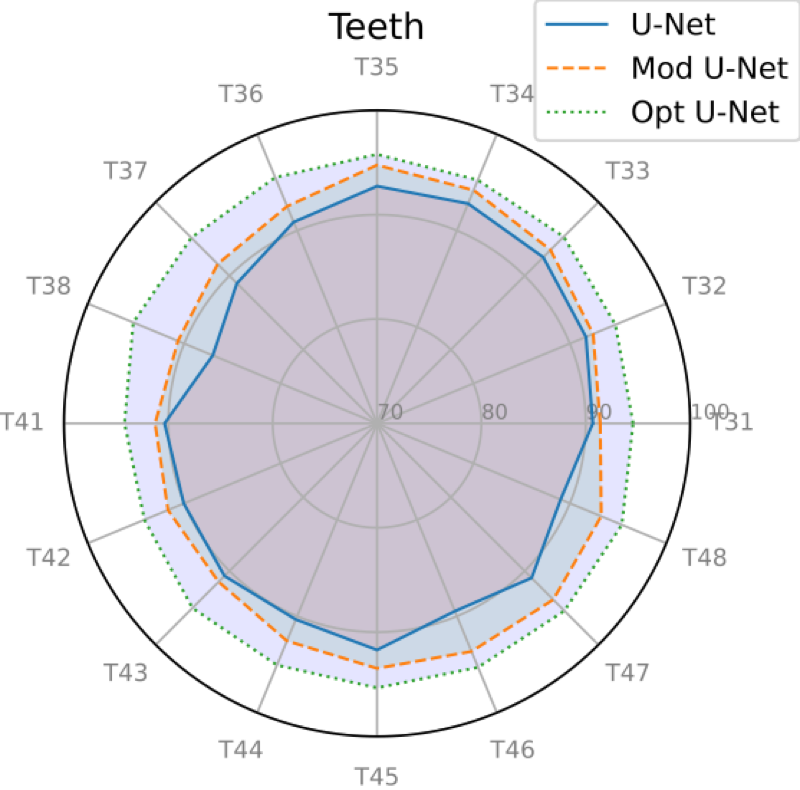
Fig.
2
shows the overall results of the proposed method in terms of average Dice
coefficient index (%) for each tooth position from the test dataset.
Using the test dataset, we
observe a similar behaviour of the cross validation procedure presented in
the paper. The Modified U-Net configuration consistently outperforms the
original U-Net model for all teeth classes. The Optimal U-Net offered the
best performances with an average dice score of
followed by the
Modified U-Net with an average Dice of
. Unsurprisingly, the U-Net
model exhibits the worst Dice coefficients with an average of
. The quite large Dice
score difference between the original U-Net and the Modified U-Net comes
from the detection inaccuracies of the molar teeth. This stems from the
fact that
of molars were missing in
our test set (composed of
X-rays) which leads us to question if
the misclassification issue on panoramic X-ray images of the original
U-Net is not due to missing teeth. So rather than considering tooth
classes, it seems interesting to analyse the performances of our model on
panoramic X-Rays where some teeth are missing compared to the panoramic
images where all teeth are present. For this purpose, we have divided the
test dataset into 2 distinct sets: a first one (A) composed of 71 images
where all teeth are present, and a second dataset (B), composed of 40
images, in which some teeth are missing. Table
1.2
summarizes the average dice coefficient and its standard deviation for
each architecture and with respect to these two sets.
Table
1: Dice coefficients and Standard Deviations for U-Net, Modified U-Net
and Optimal U-Net configurations with respect to sets A and B.
|
A
|
B
|
|
U-Net
|
89.9 (0.076)
|
79.5 (0.189)
|
|
Mod-UNet
|
92.2 (0.049)
|
86 (0.142)
|
|
Opt-UNet
|
94.7 (0.018)
|
94(0.035)
|
Table
2: Results of the object detection task (Mask R-CNN) on the test set
and set (B) using the best network solution according to mAP. Tooth
detection and numbering is done using bounding boxes and an IoU
threshold of 0.5
| Sets |
Test dataset |
Set (B) |
| Total Number of teeth |
3552 |
1280 |
| Total Number of present teeth |
3382 |
1111 |
| Detected and correctly classified |
3333 |
1069 |
| Miss-classified detections |
36 |
34 |
| Not detected Teeth |
13 |
8 |
As expected, when teeth are
missing, the performances drops down for the three networks, however,
the Original U-Net performances significantly decrease for the set (B)
with an average dice of
. The proposed framework improves
the performances over the regular U-Net for panoramic images with
missing teeth ( for U-Net, up to
for Modified U-Net on set (B)).
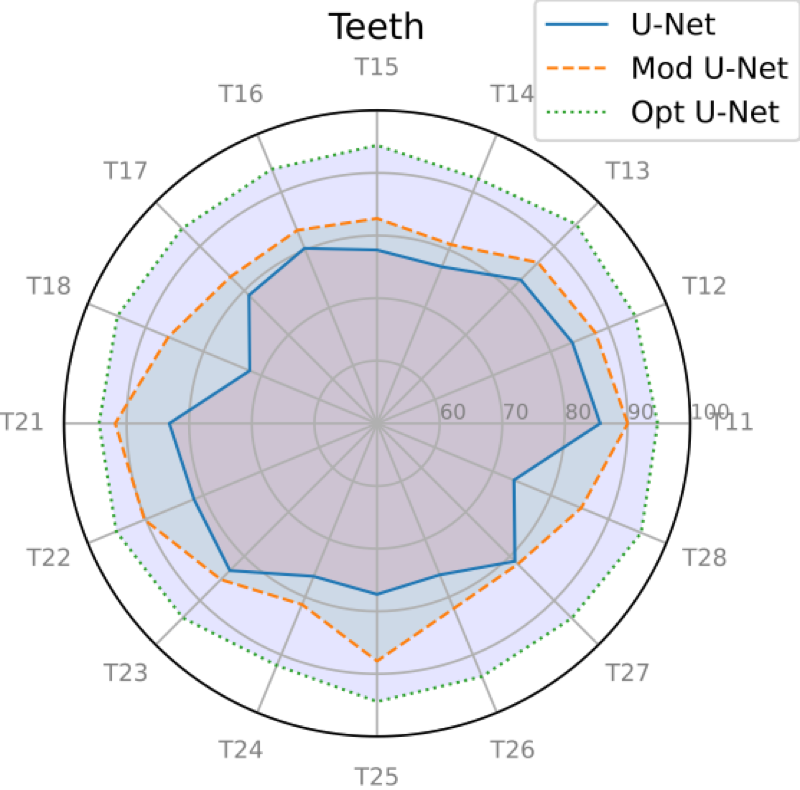
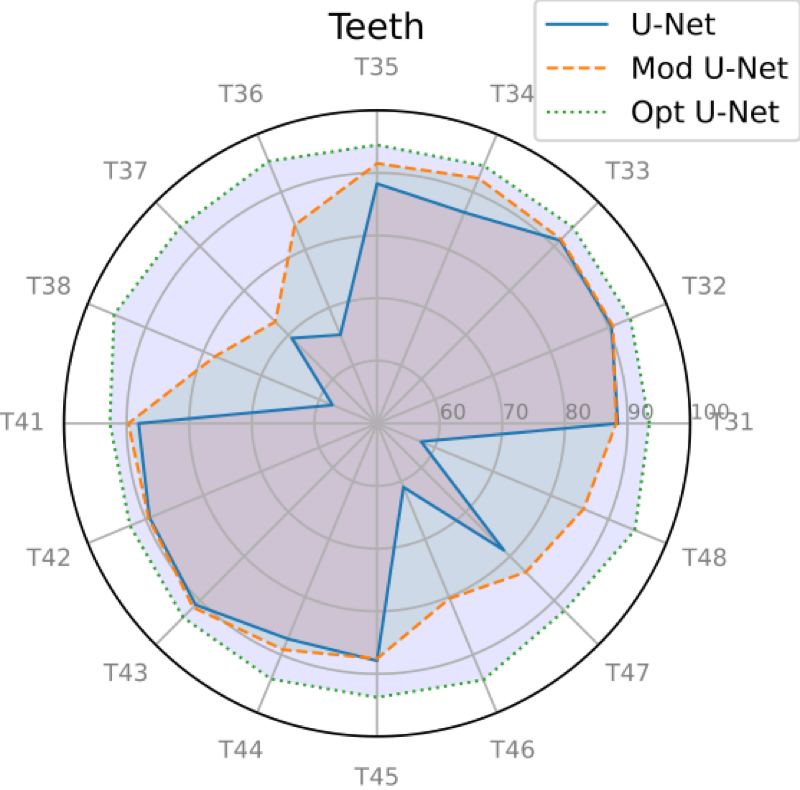
For more quantitative results
and comparison of dice coefficients for all tooth classes between the sets
A and B, please refer to Fig
3.
1.3
More on Tooth detection
The difference of Dice ratio
between the Modified U-Net and the Optimal U-Net for set (B) is explained
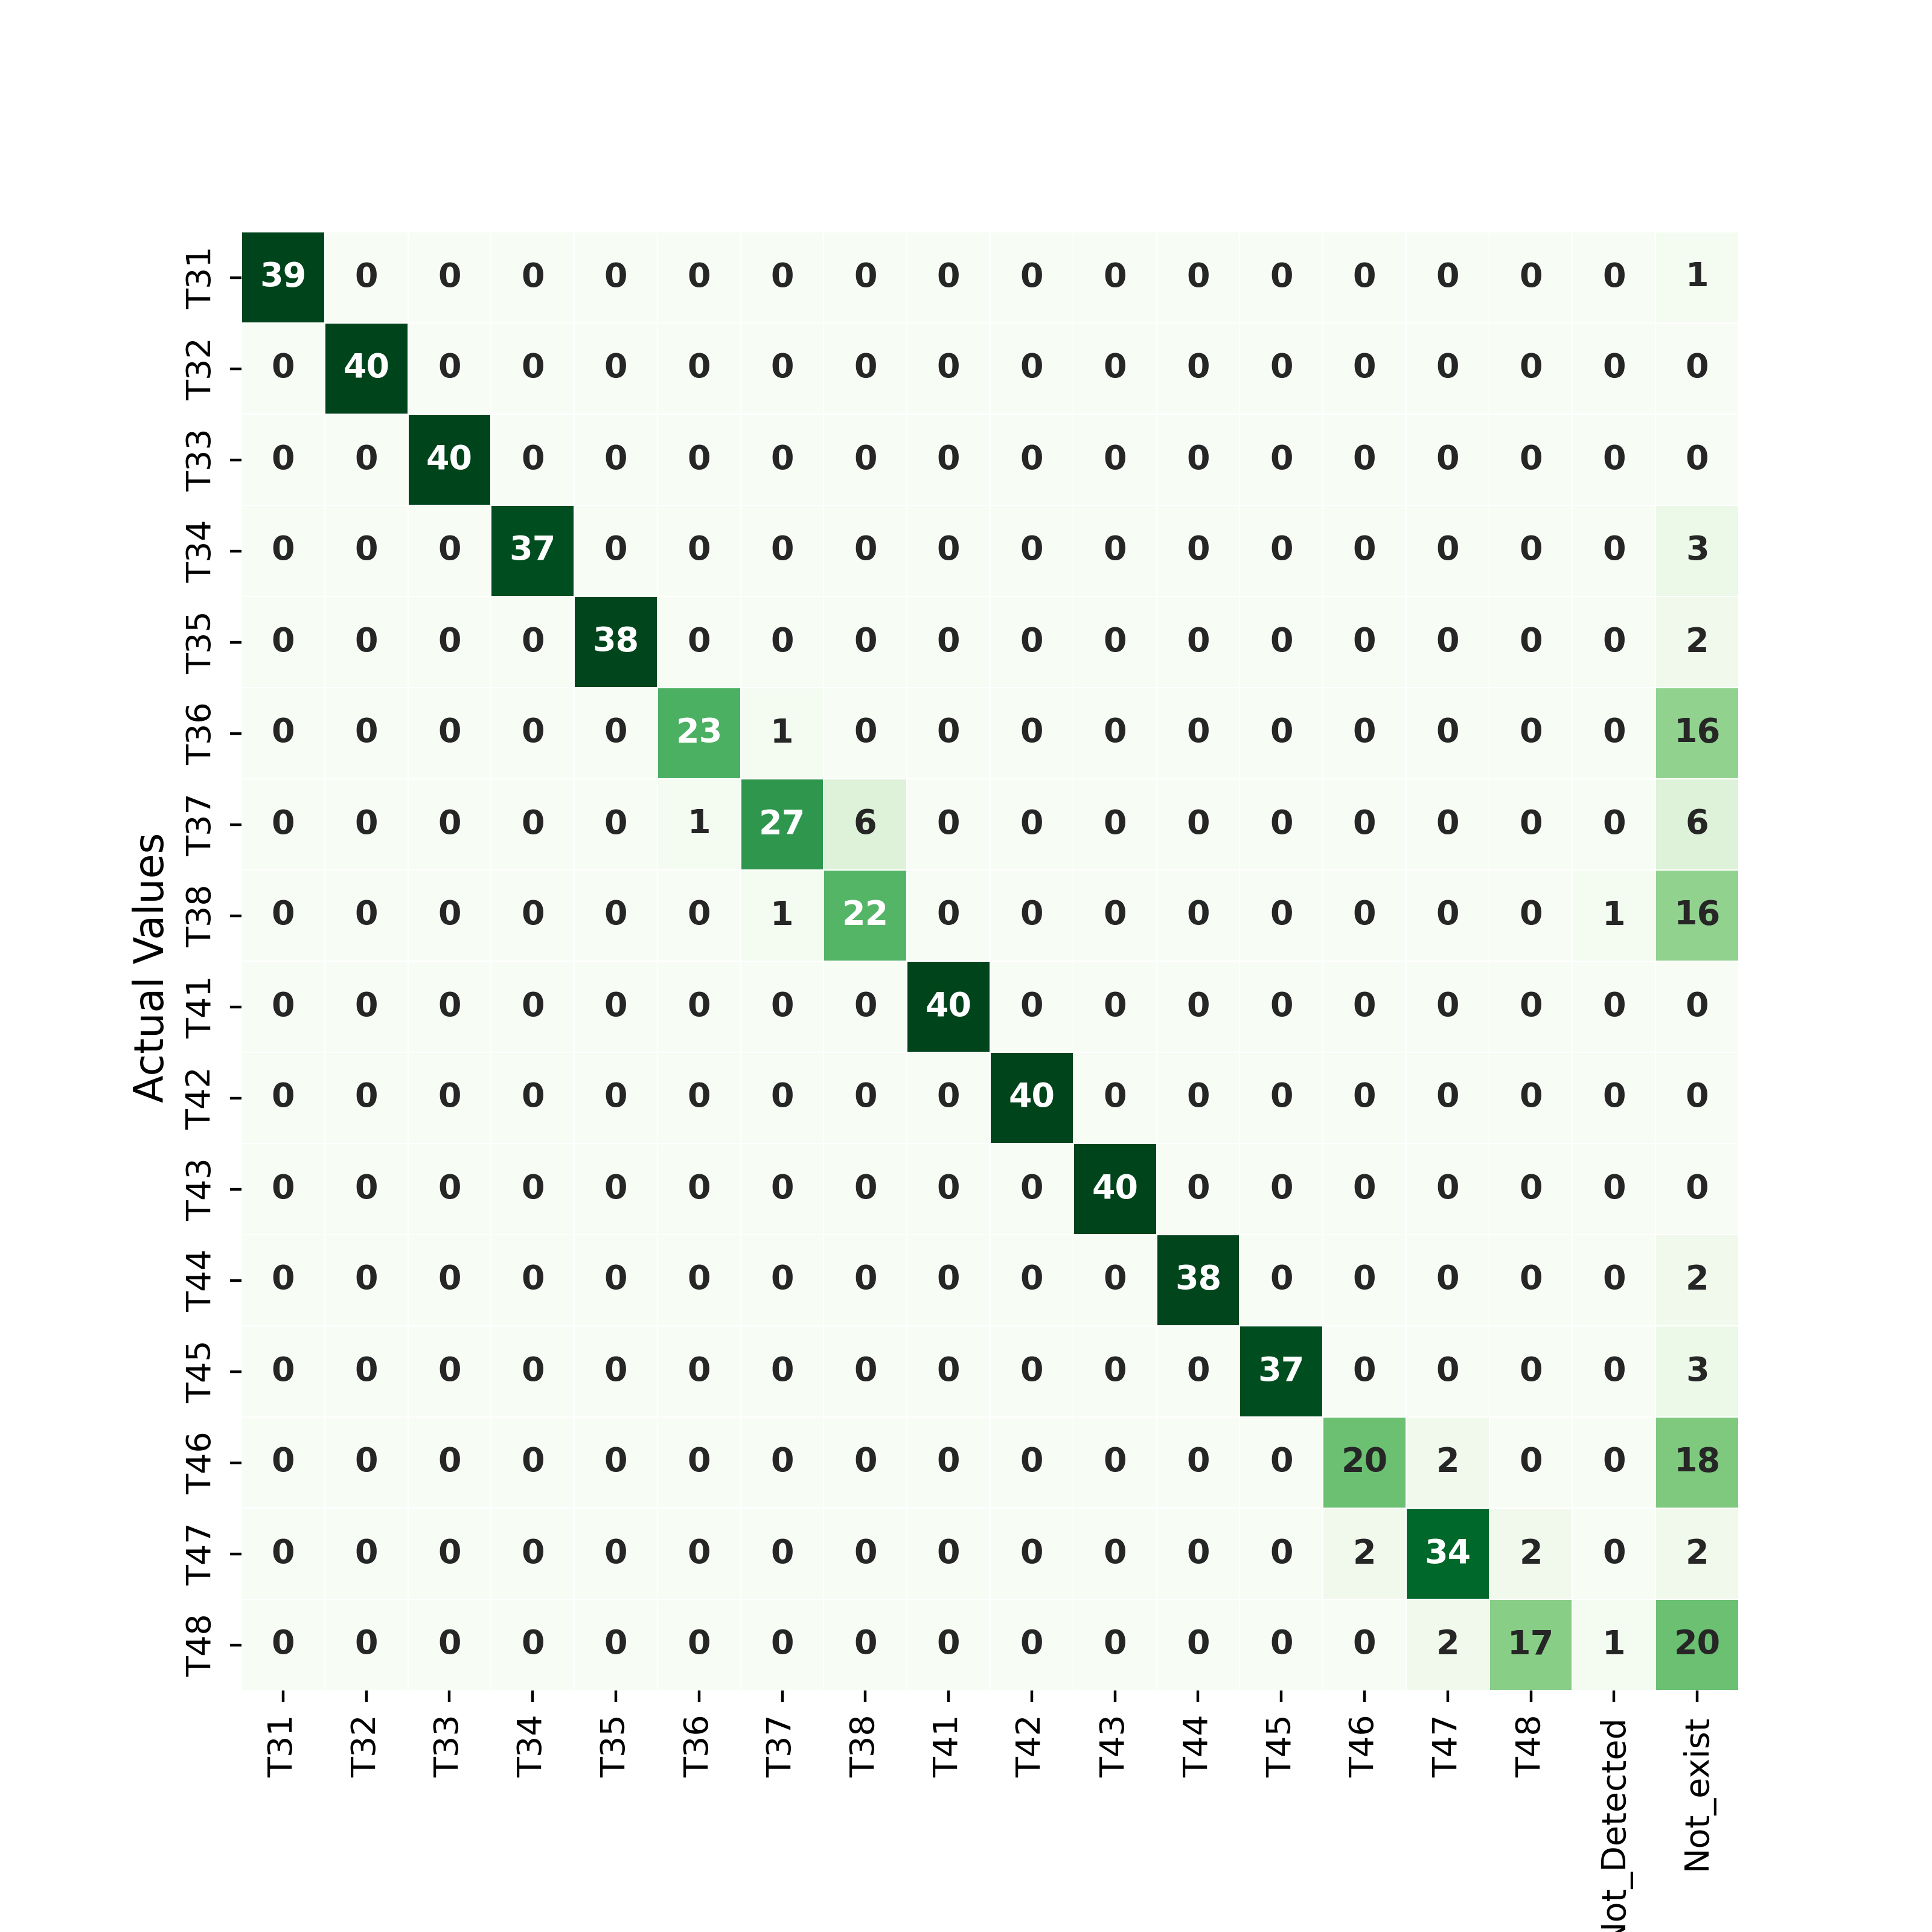
by the rare miss-labeling of teeth by the object detection model. Table
1.2
presents some results of the Object detection Model on the test set and on
set (B). From Table
1.2, we can witness 34
miss-classified detections among a total of 36 in the set (B). In fact
when a tooth is missing, the model detection network could in some cases
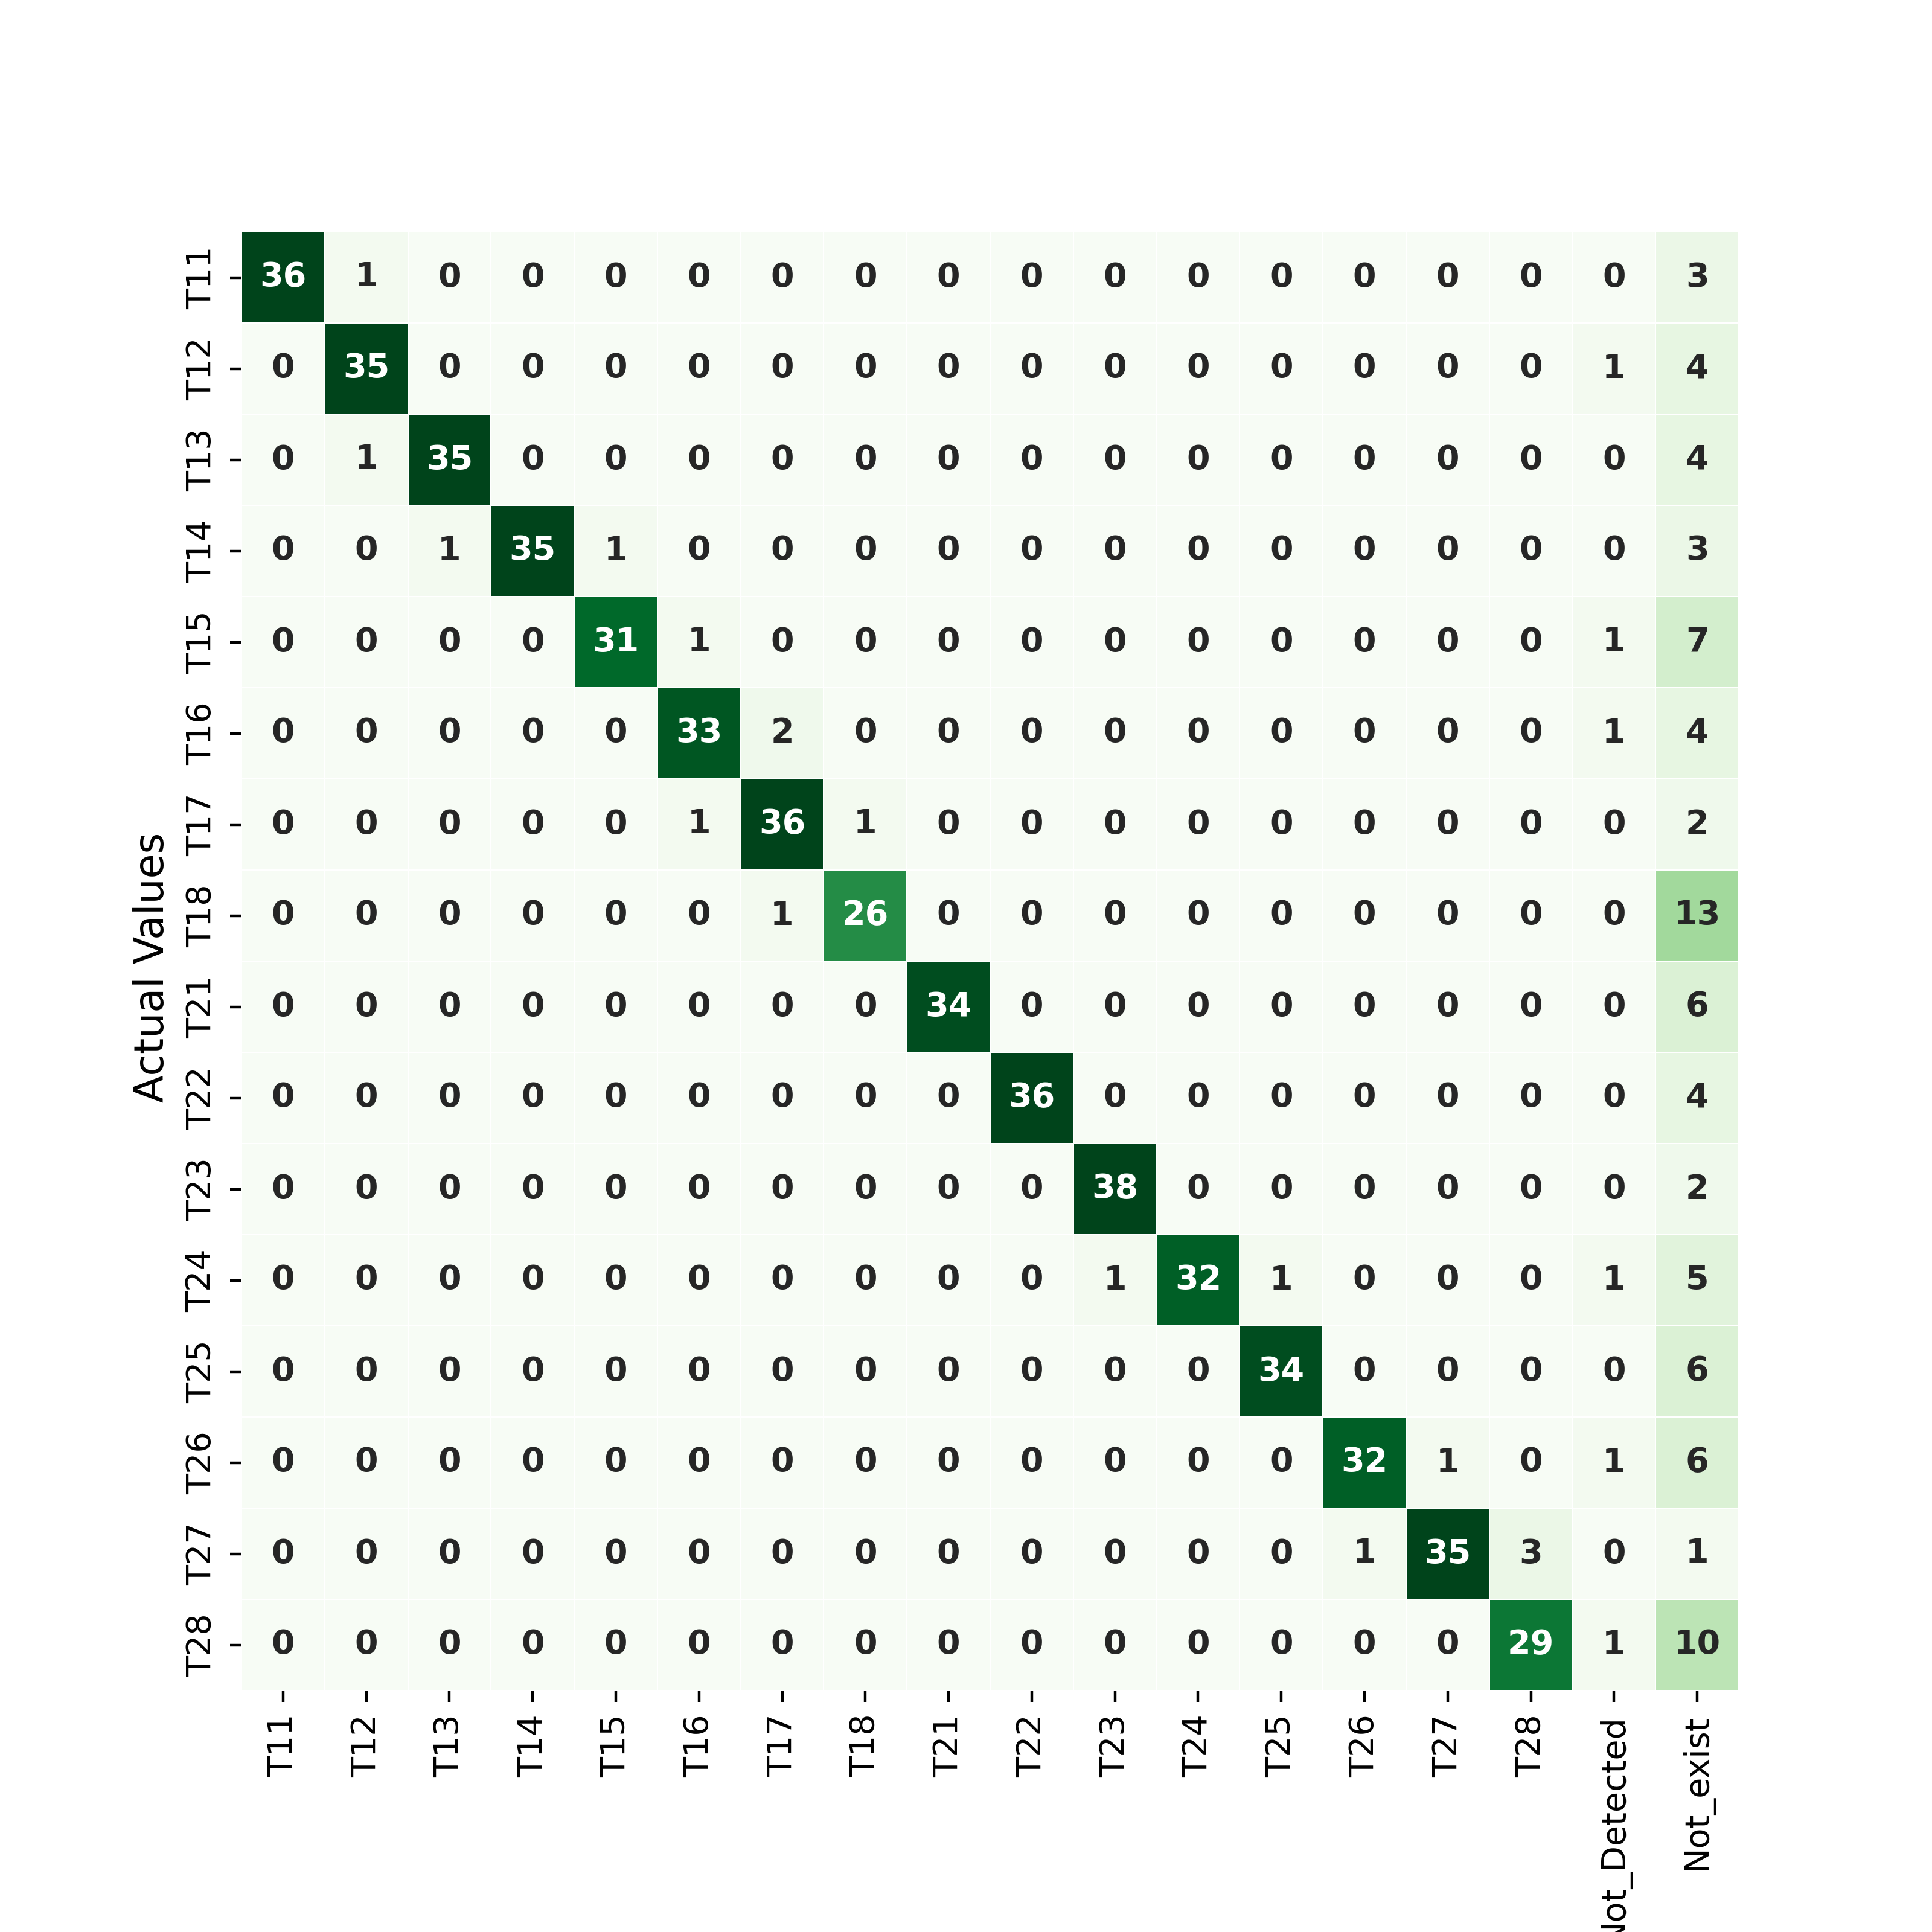
classify its nearby tooth by the position of the missing one. Figures
4
and
5 present confusion matrices for a
IoU detection threshold on the set
(B), corresponding respectively to the upper teeth and to the lower teeth.
We observe that the rare miss-classification occur especially for teeth
being numbered as one of their missing neighbors.
2
Training on a new dataset
2.1
Nantes University Dataset Acquisition
In order to implement a deep
neural network that can automatically detect and segment teeth in
panoramic x-ray images, the acquisition of a large dataset with high
variability is important and its composition has a decisive impact on the
model's performances. Here, we try to evaluate our model's performances on
a different dataset that the one we used earlier. So we have collected 81
images from the dentistry department of the University hospital in Nantes.
The provided images were then classified into 6 categories according to
the presence/absence of all teeth, and the presence/absence of
restorations. The images categorization was performed manually,
individually selecting the images and verifying the number and the
characteristics of the teeth (See Table
2.1).
Table
3: Data set categories
|
Category
|
Description
|
Number of
images
|
|
1
|
Images with all
the teeth, with restoration
|
10
|
|
2
|
Images with all
the teeth, without restoration
|
10
|
|
3
|
Images with
many missing teeth(above 10)
|
13
|
|
4
|
Images with
some missing teeth and with large restorations
|
22
|
|
5
|
Images with
some missing teeth and with small restorations
|
14
|
|
6
|
Images with
some missing teeth and no restorations
|
12
|
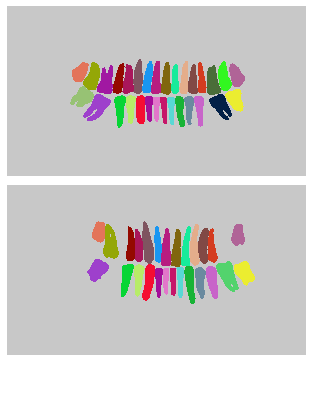
The second step consisted of
annotating the images (obtaining the multi-channel binary images), which
corresponds to the detouring of each tooth position in the panoramic
X-ray. This was accomplished by 4 different dental students of the
University of Nantes. Then the images were cut off to disregard non
relevant information (white border around the images and bones parts) with
the constraint of keeping the object of interests (Teeth). The cropped
images were saved in the new dimension of
Finally, using successive
morphological operations of dilatation and erosion, we were able to
separate overlapping teeth in the ground truth segmentation.
It is worth noting that the
ODON data set is a relatively small dataset (less than 100 images)
containing X-ray images varying mostly with respect to the number of teeth
and with many missing teeth. Moreover it contains images of inhomogeneous
qualities (strongly varying noises and contrasts). To summarize, the
IvisionLAB dataset is quite homogeneous but rather large, whereas our own
is much smaller but with a larger diversity. In order to investigate
whether our method generalizes well, it has been tested using the manual
bounding boxes onto these two strongly different datasets: Nantes
University dataset (containing 81 images), and a subset of IvisionLab
dataset (81 images collected from the 543 initial dataset). Note that we
deliberately picked up 81 images in order to have the same number of
images in both datasets for an exhaustive comparison. Moreover, we also
tried to have a similar distribution between the 2 datasets with respect
to the number of panoramic x-rays with missing teeth and with
restorations.
As the number of images is
small, we chose to use manual bounding boxes to train our network. The
idea is to test the generalization of the Modified U-Net using 2 different
dataset acquisitions. However, it is worth noting that an object detection
network (Mask R-CNN) must be trained with a larger dataset for a better
precision as the one used in the paper [
1].
2.2
Training procedure
To train our network, we fixed
for both datasets, the training set to have 51 images, the validation set
to have 18 images and the test set to have 12 images. As in [
1],
we use Dice loss as the criterion to optimize the U-Net model parameters.
Moreover, the Adam optimizer is used to train our model with an initial
learning rate of
. We set the number of training
epochs to be
with a batch size of 2.
2.3
Results
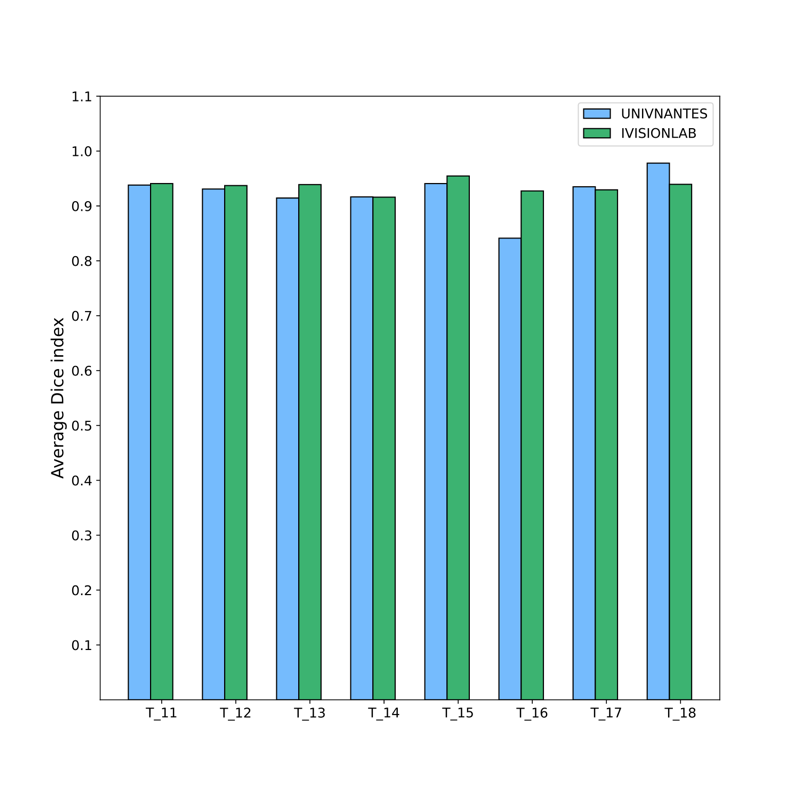
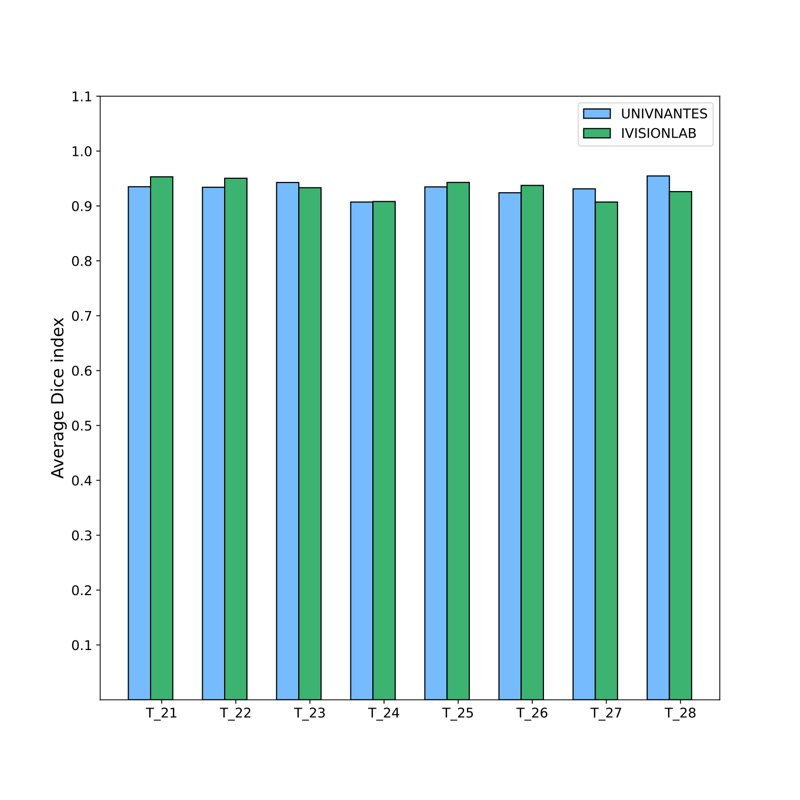
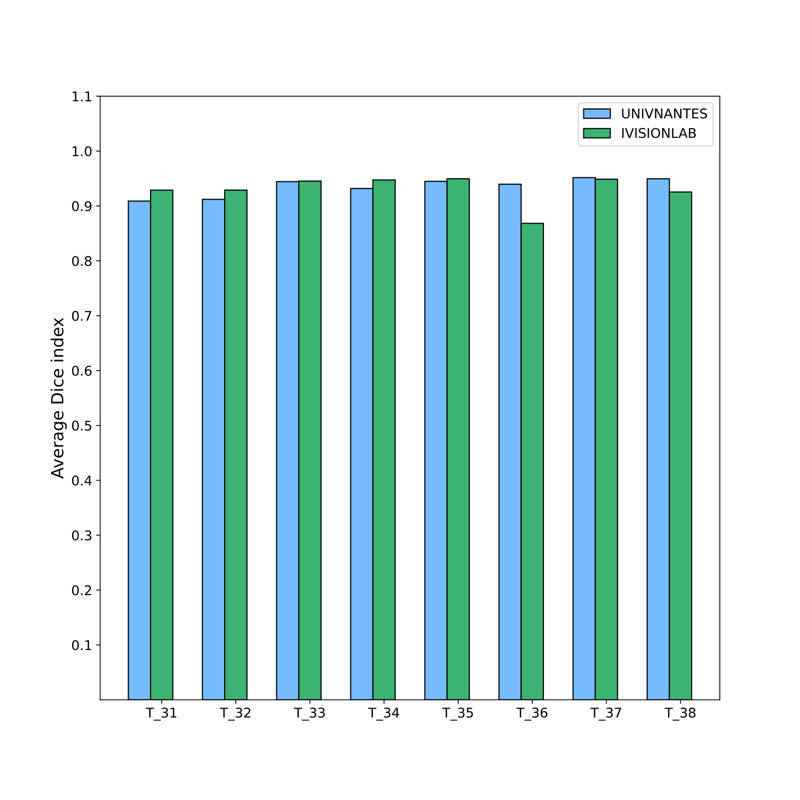
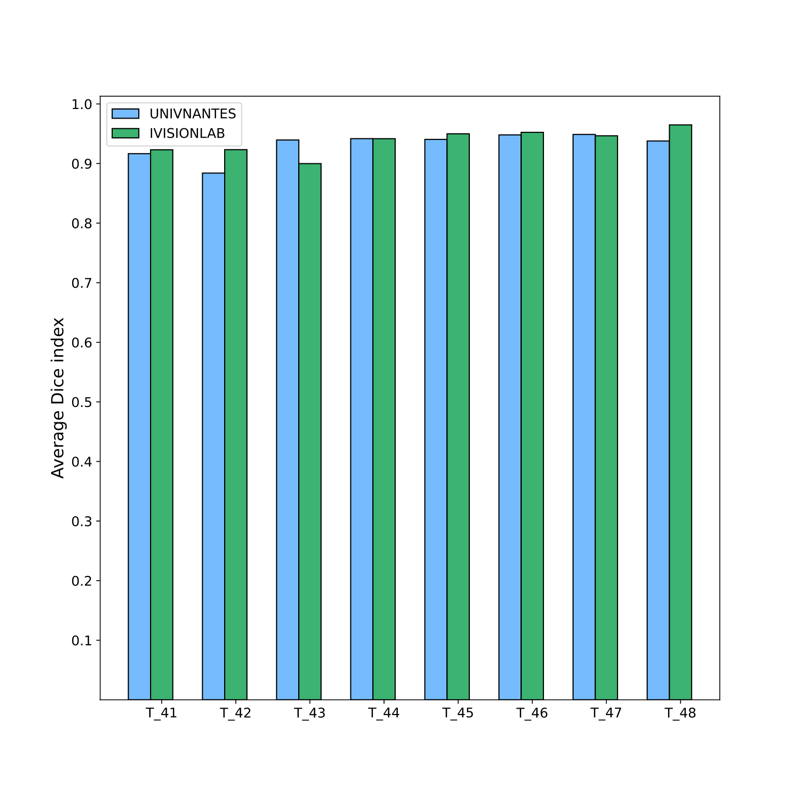
In this section, we present
only a brief summary of the results based on the Dice coefficient.
Figures
7 and
8 show the
overall results of the proposed method in terms of the average Dice
coefficient index (%) for each tooth position with respect to the two
datasets. For the two totally different datasets, we observe a comparable
performance on each tooth class. Using unseen data, the model offered very
good performances with an average Dice score of
for NantesUniv dataset
and
for the portion of the
IvisionLab dataset.
2.4 Future step
As described earlier, in order
to automatically recognize the teeth and various dental treatments on
panoramic x-rays, we used the combination of 2 neural networks allowing us
to segment and classify the teeth in the X-rays. So far, the NantesUniv
dataset consists only of 81 images presenting many missing teeth and
various dental treatments. Using manual bounding boxes to train our
Modified U-Net network showed very good performances on teeth
segmentation. However a larger dataset is needed to train an object
detection network for a high detection accuracy. While waiting the
acquisition of a larger dataset with high variability, using some data
augmentation transformations could be helpful.
References
1R.
Nader, A. Smorodin, N. De La Fourniere, Y. Amouriq, and F.
Autrusseau, "Automatic tooth
segmentation on panoramic X-rays using deep neural networks",
in International Conference on
Pattern Recognition (ICPR) (2022).
2Bernardo
Silva, LaÃs Pinheiro, Luciano Oliveira, and Matheus Pithon,
"A study on tooth segmentation and numbering
using end-to-end deep neural networks", in 2020
33rd SIBGRAPI Conference on Graphics, Patterns and Images
(SIBGRAPI) (2020), pp.
164-171.