Important
note:
The work
presented here is protected by
patent #EP
22305928.8,
submitted on
June 27th 2022.
I am currently involved in a project
with the neuro-radiology and interventional surgery departments of
the University Hospital in Nantes. In the framework of this
project, we have several aims.
We intend to :
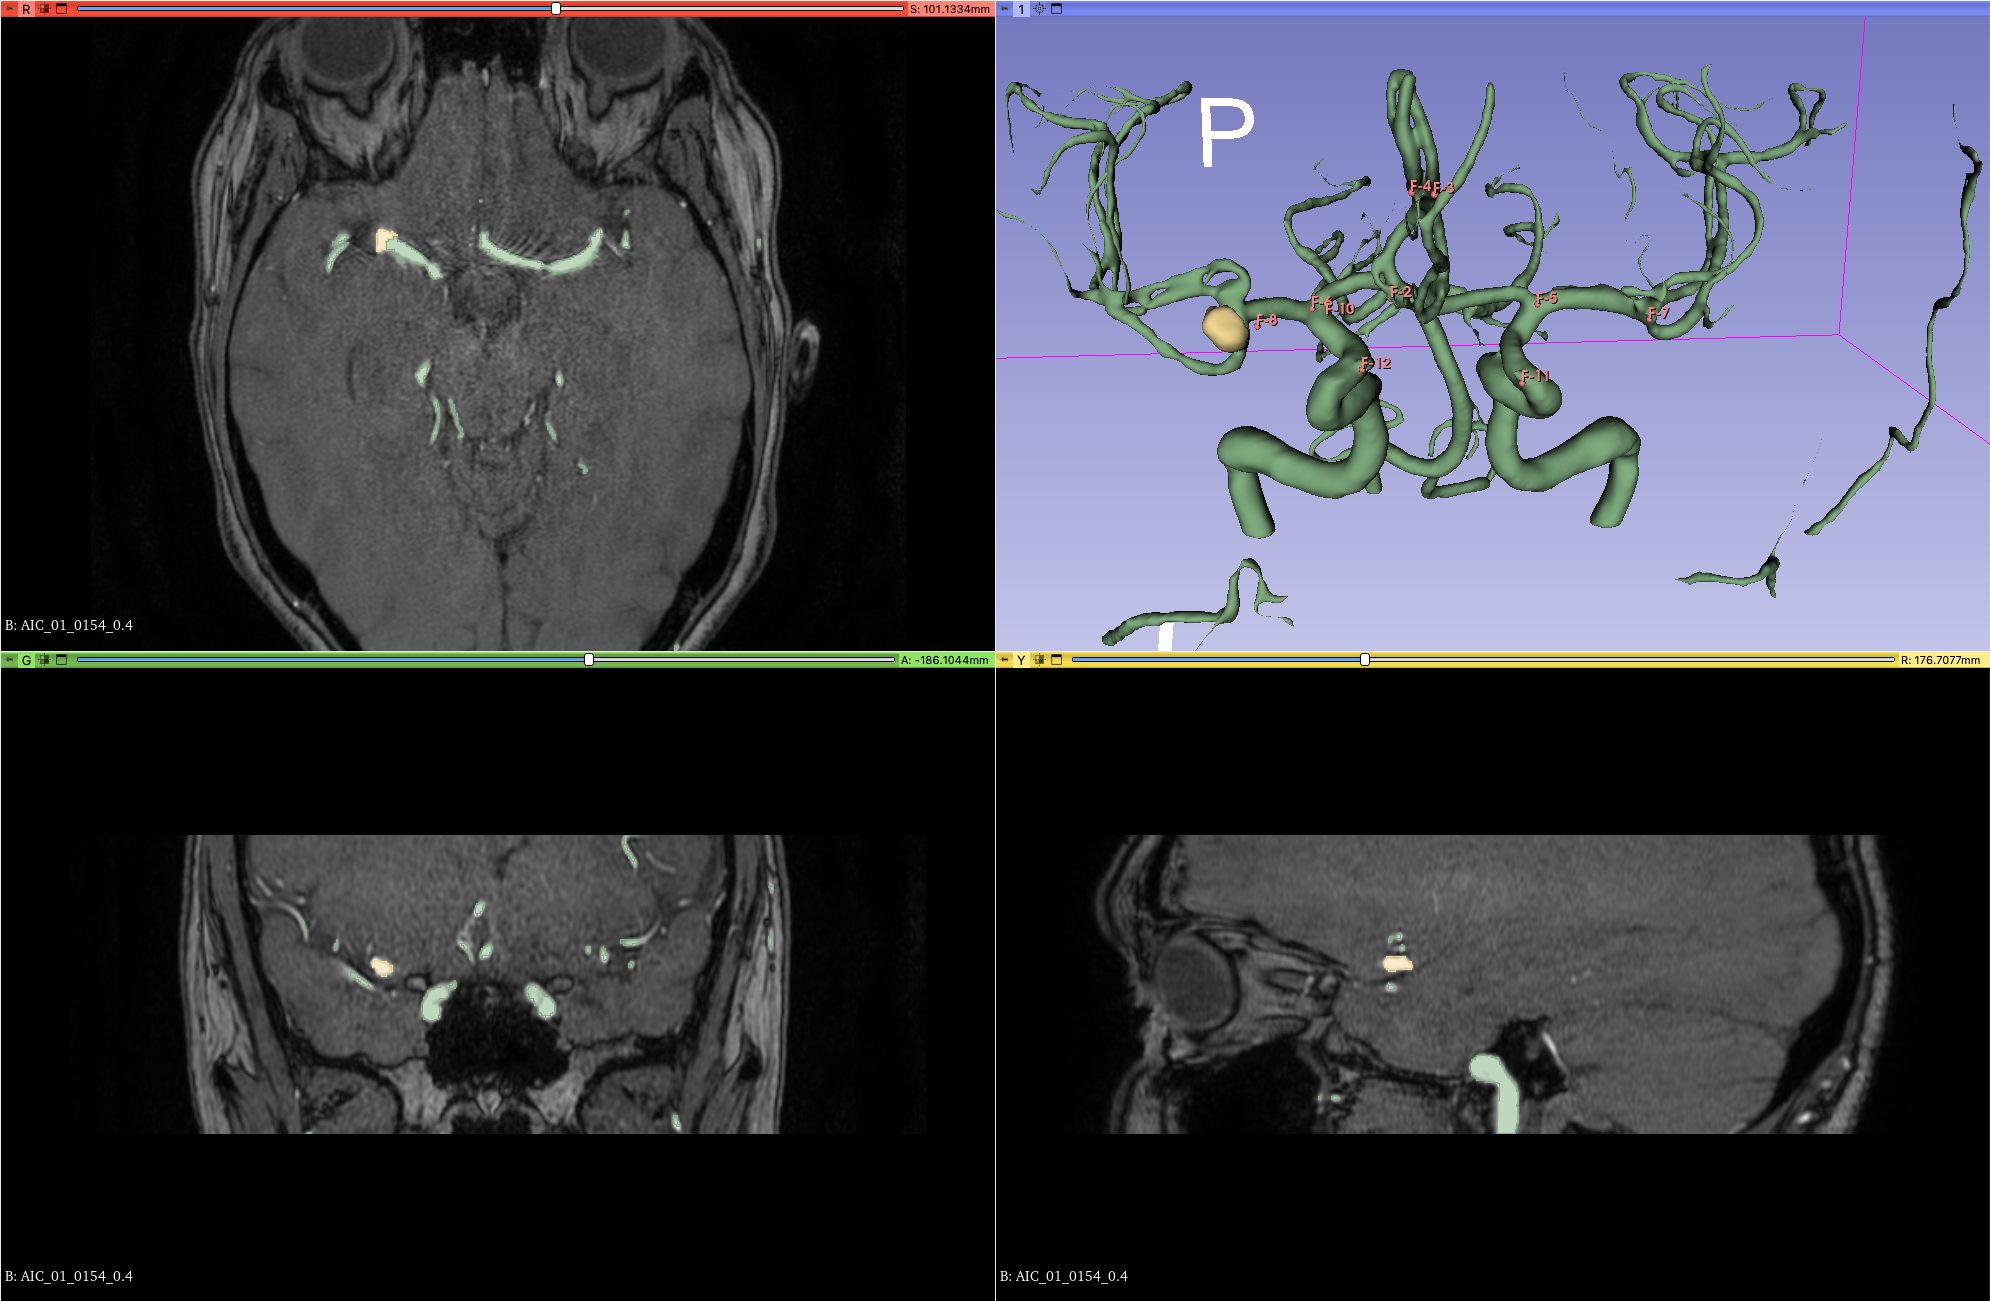
- Get an optimal segmentation of the cerebral vascular tree on
MRA-TOF acquisitions.
- Automatically recognize the 15 bifurcations of interest along
the Circle of Willis.
- Detect and segment Intra-Cranial Aneurysms (ICA).
Source code available there :
The ICAs commonly occur onto a
specific portion of the vascular tree called the Circle of Willis
(CoW). The figure below shows the layout of the CoW along with the
15 bifurcations of interest (yellow labels).

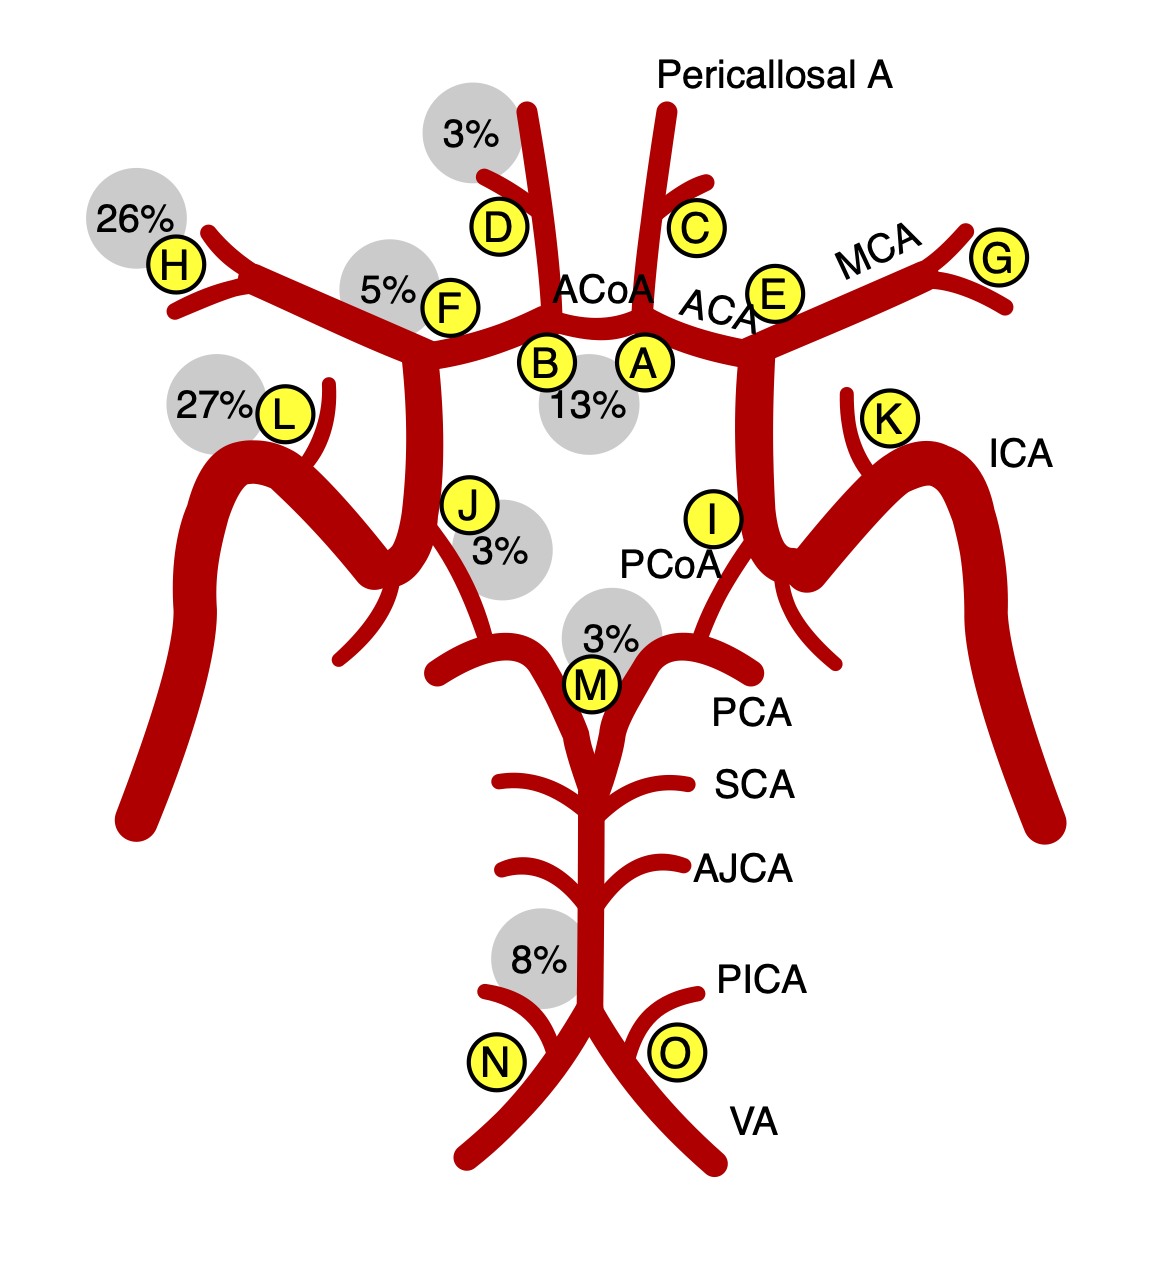
(Note : click on the figures to
enlarge)
As far as deep learning methods are
concerned in medical imaging (or most of the other applications)
one of the greatest bottlenecks is the lack of training data.
Commonly, experts
(neuro-radiologists in our case) are asked to manually label or
segment numerous images, so that a CNNN can be trained on a given
task. This manual segmentation/labeling task is very tedious and
time consuming.
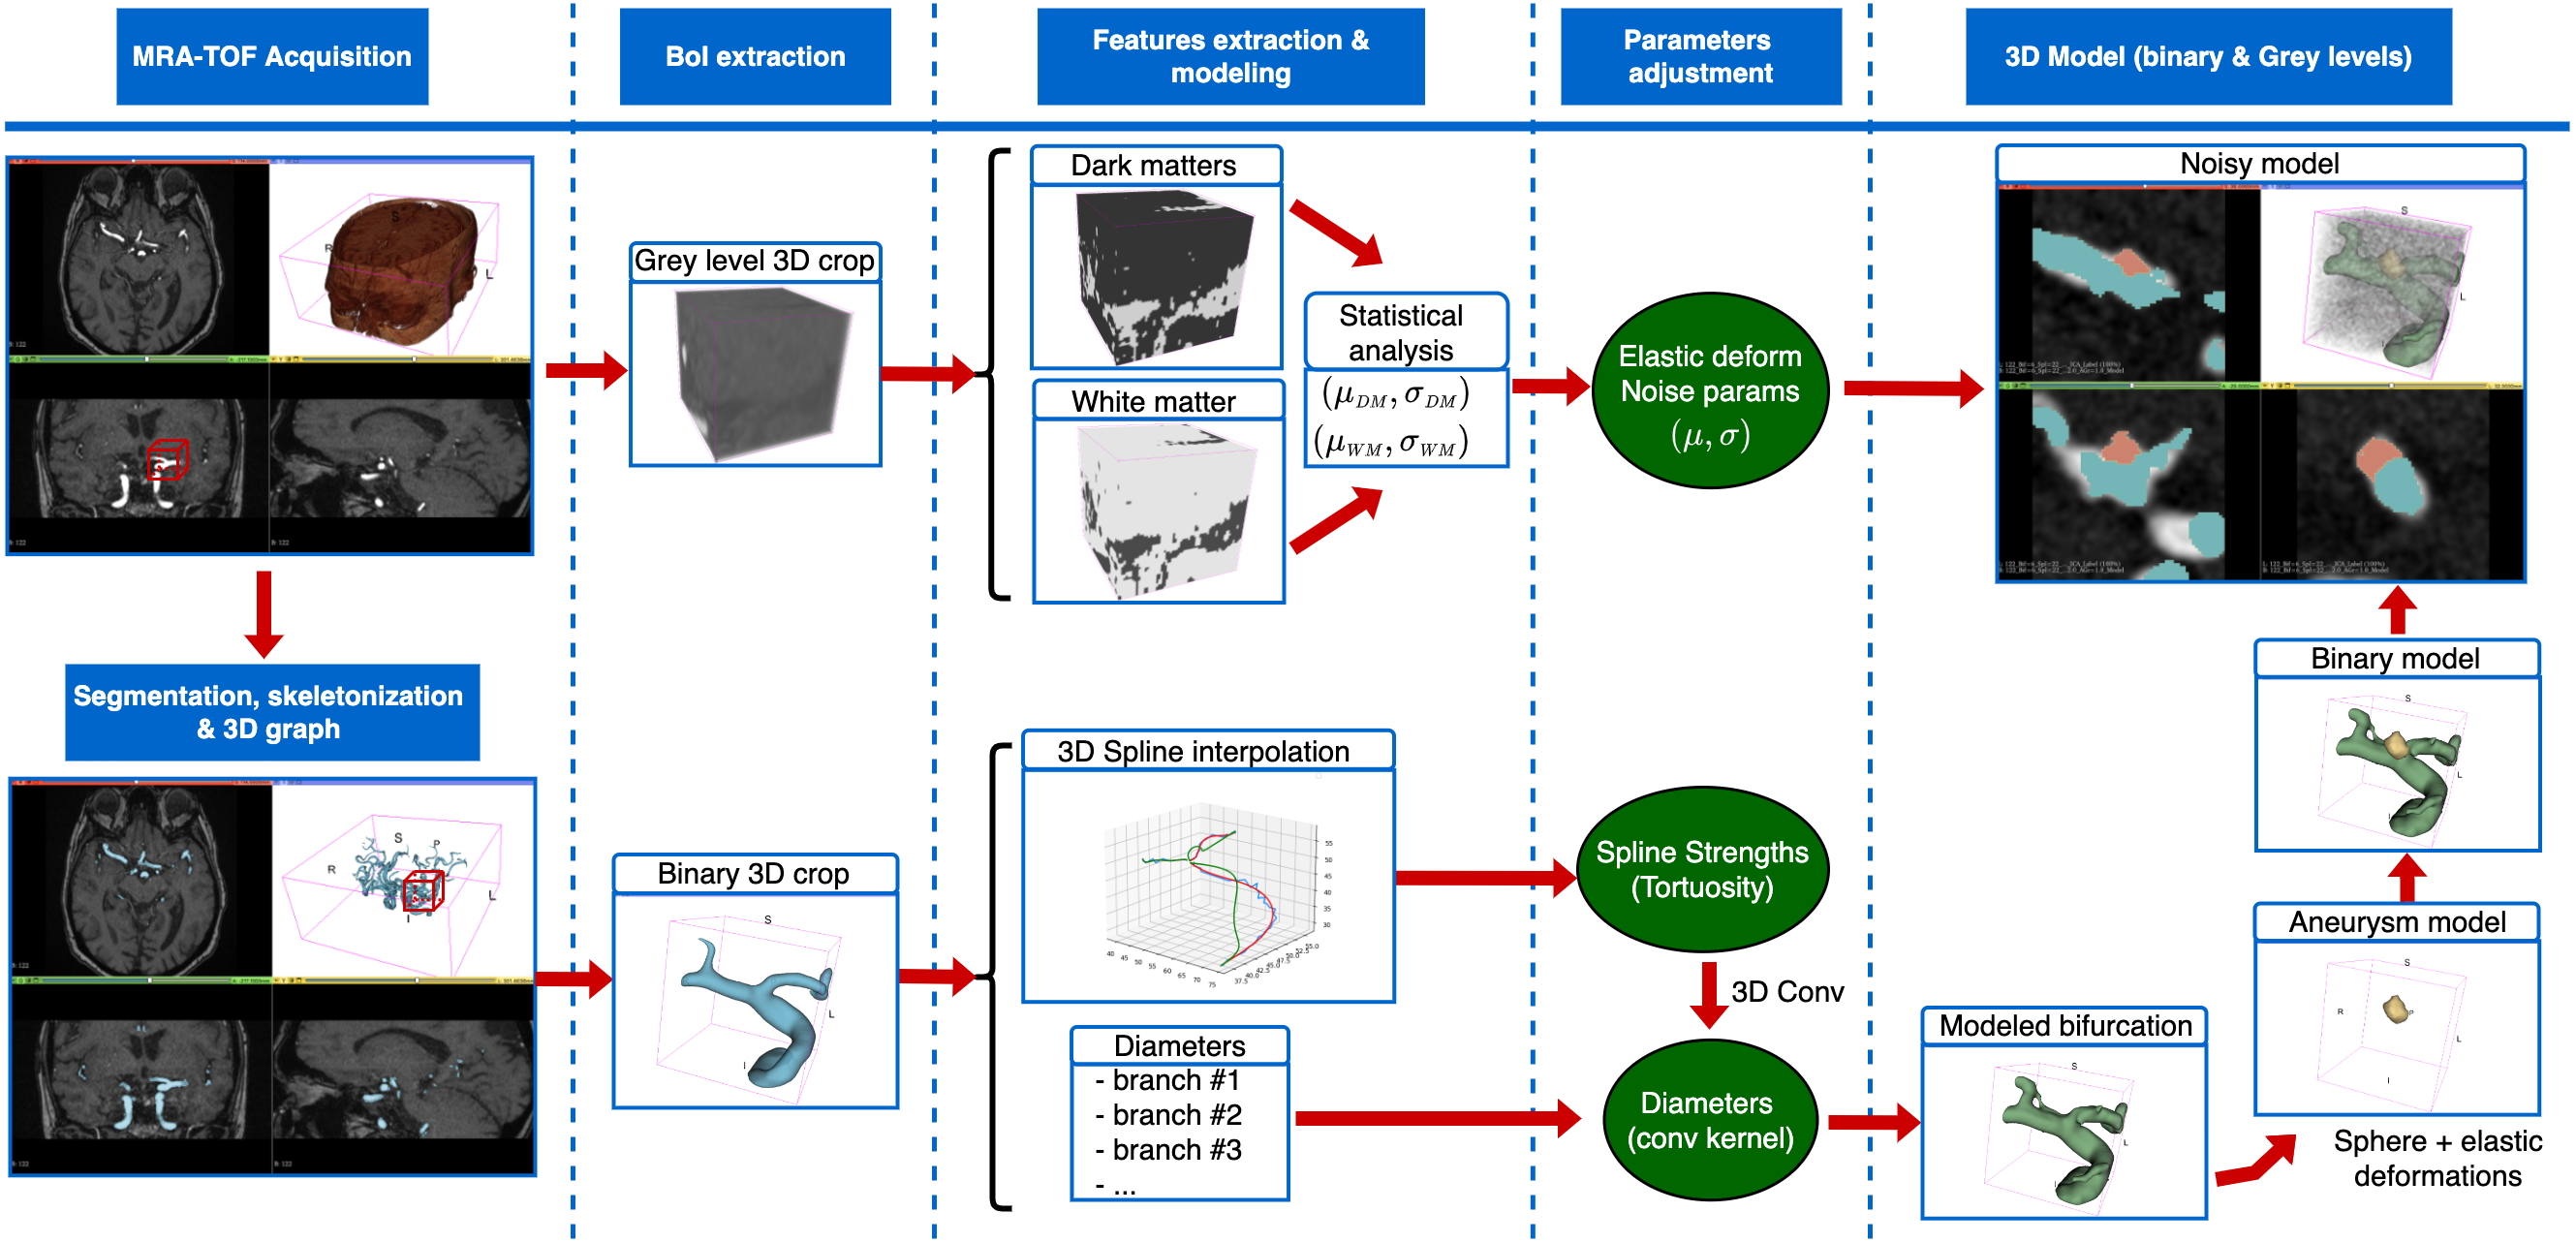
Our main objective in this project is
to propose a synthetic model of the vascular tree. Such a model
would allow to generate extremely high quality augmentation
images, and hence allow to reduce the labeling burden while
exhibiting very high performances.
Basically, this model aims to mimic
as best as possible some portions of the vascular tree, and more
precisely, the bifurcations of interest.
Our model exploits the spline
functions to fit the arteries' centerlines. Some modifications of
the spline coefficients, and of the convolution kernel (bringing
some thickness to the modeled arteries) allows us to tweak a
little bit the shape of the arteries.
The vascular model also includes a
thorough analysis and modeling of the background noise. Hence, we
can very accurately replicate any portion of the brain (as
acquired on a MRA-TOF acquisition).
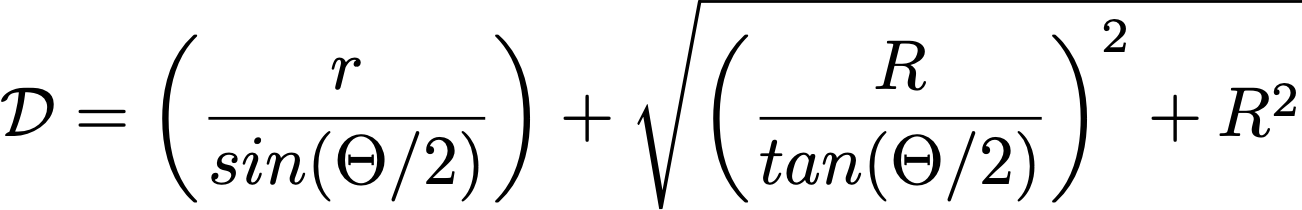
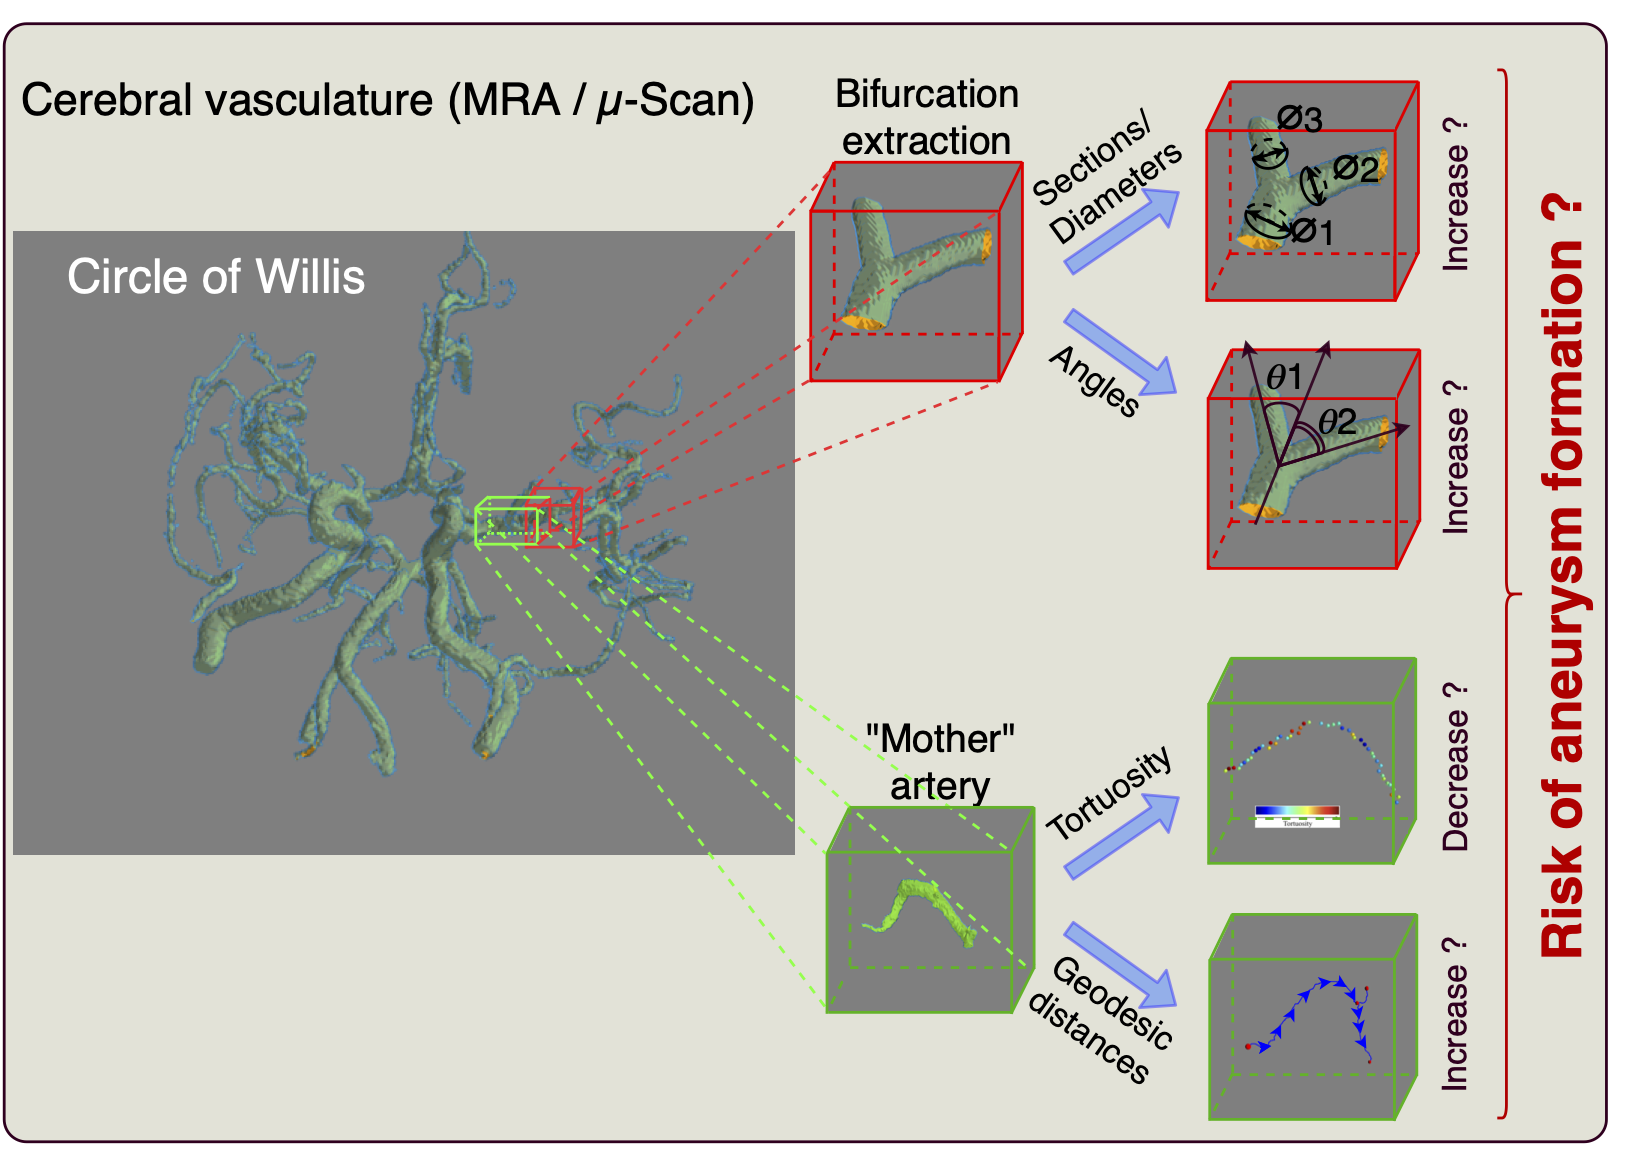
Thanks to our previous works, we have some tools to
measure various features from the arterial tree bifurcations (see
schematic representation below).
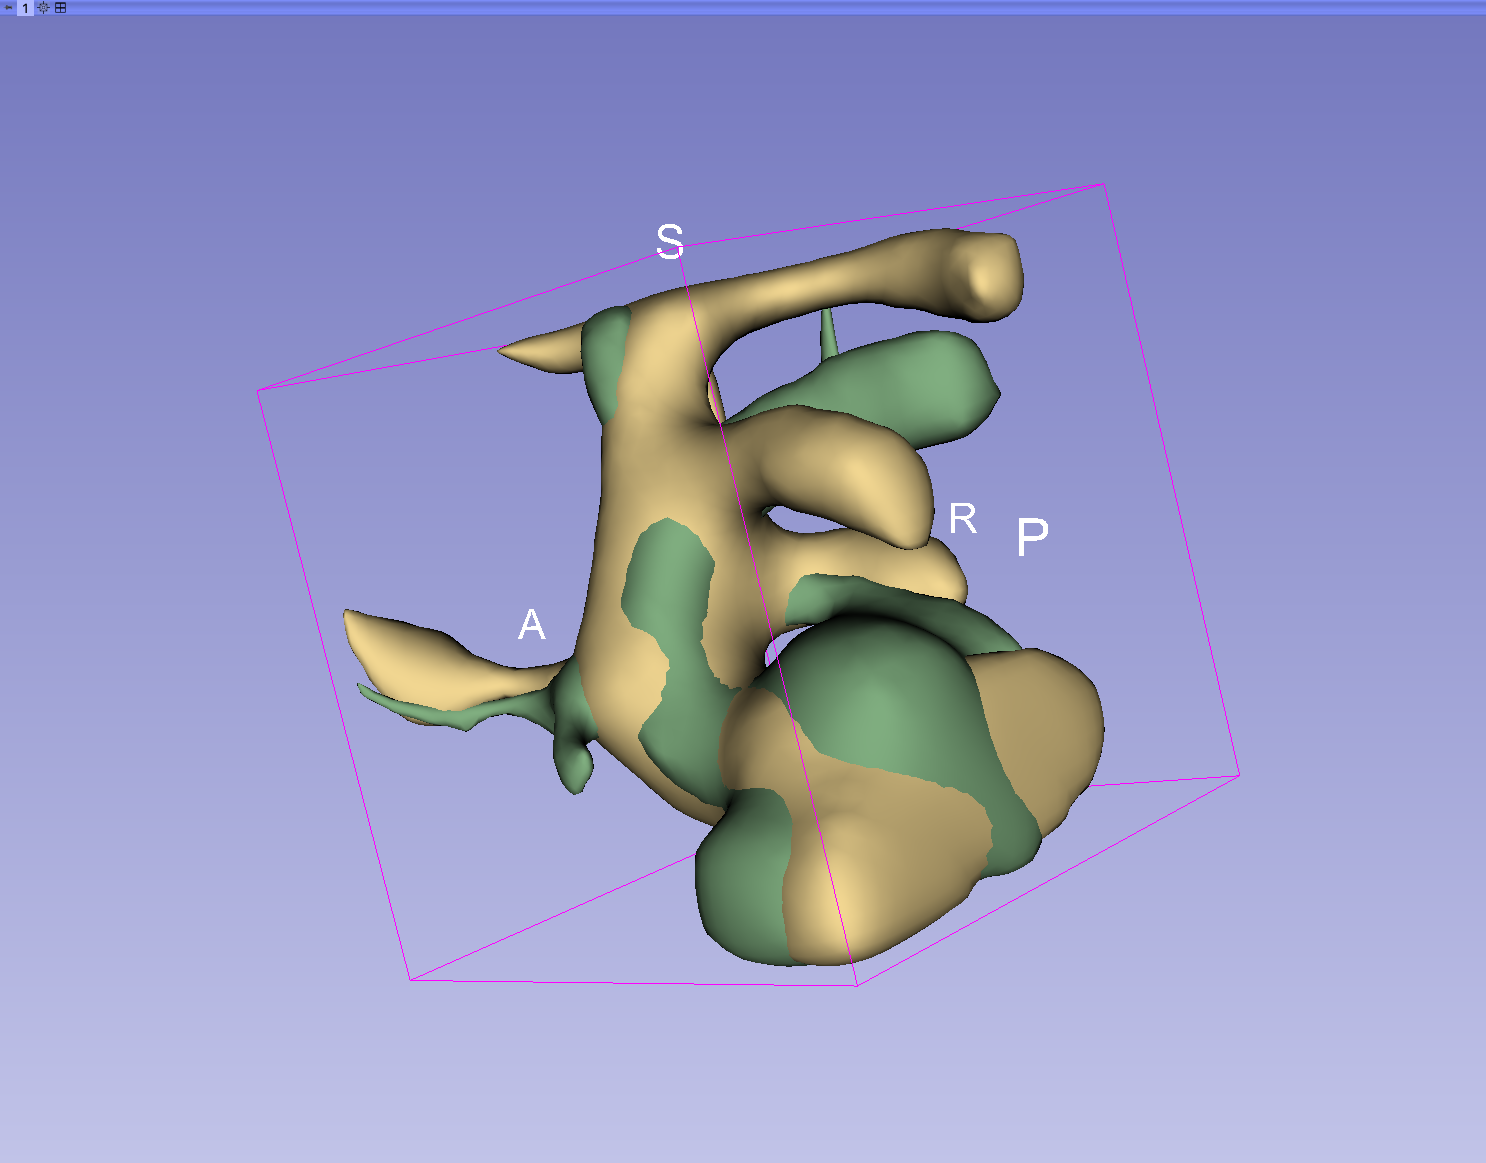
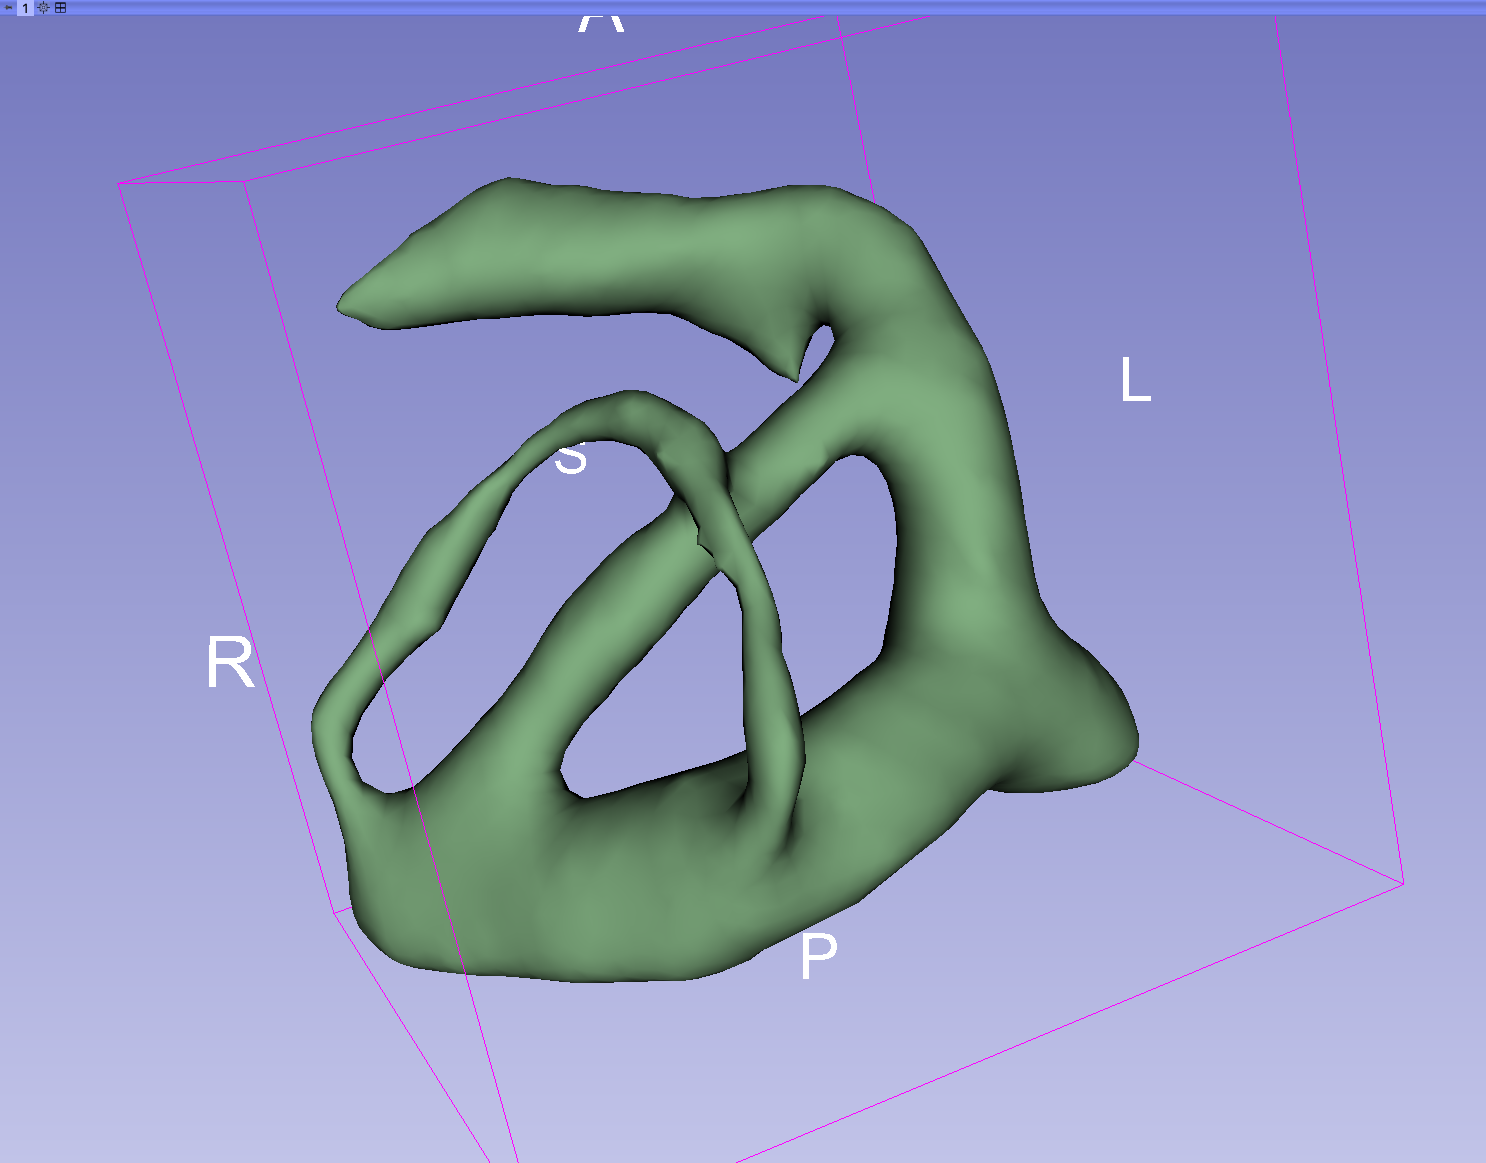
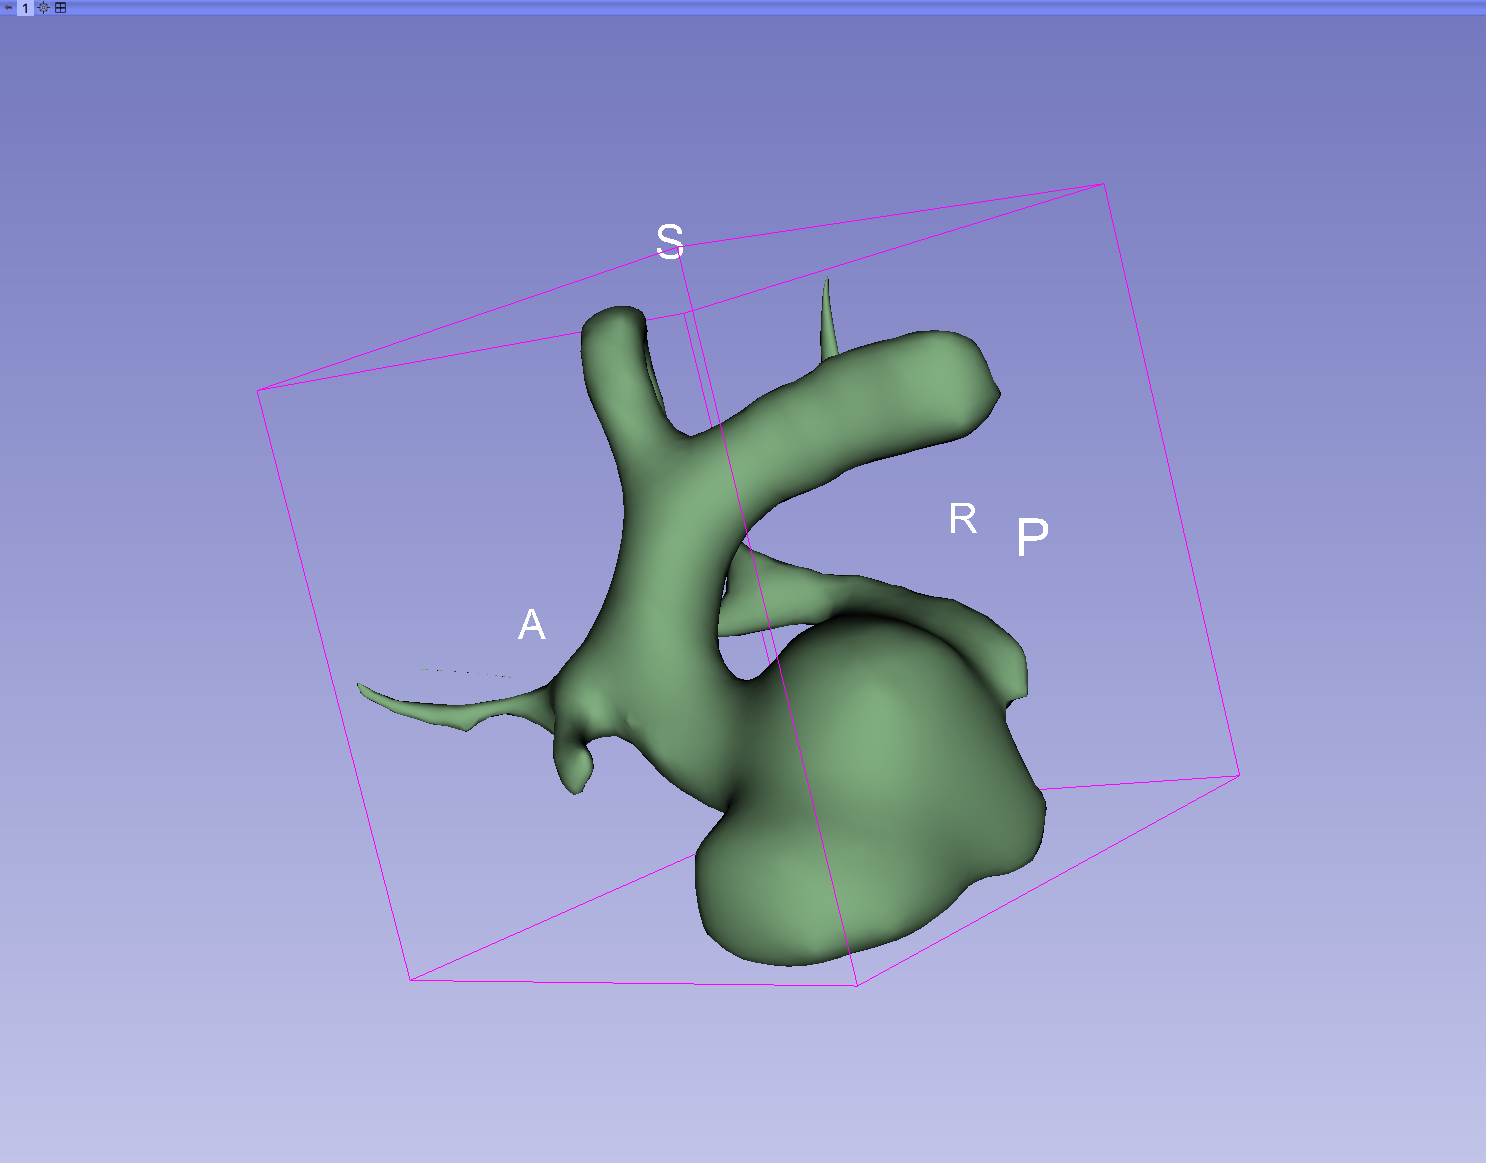
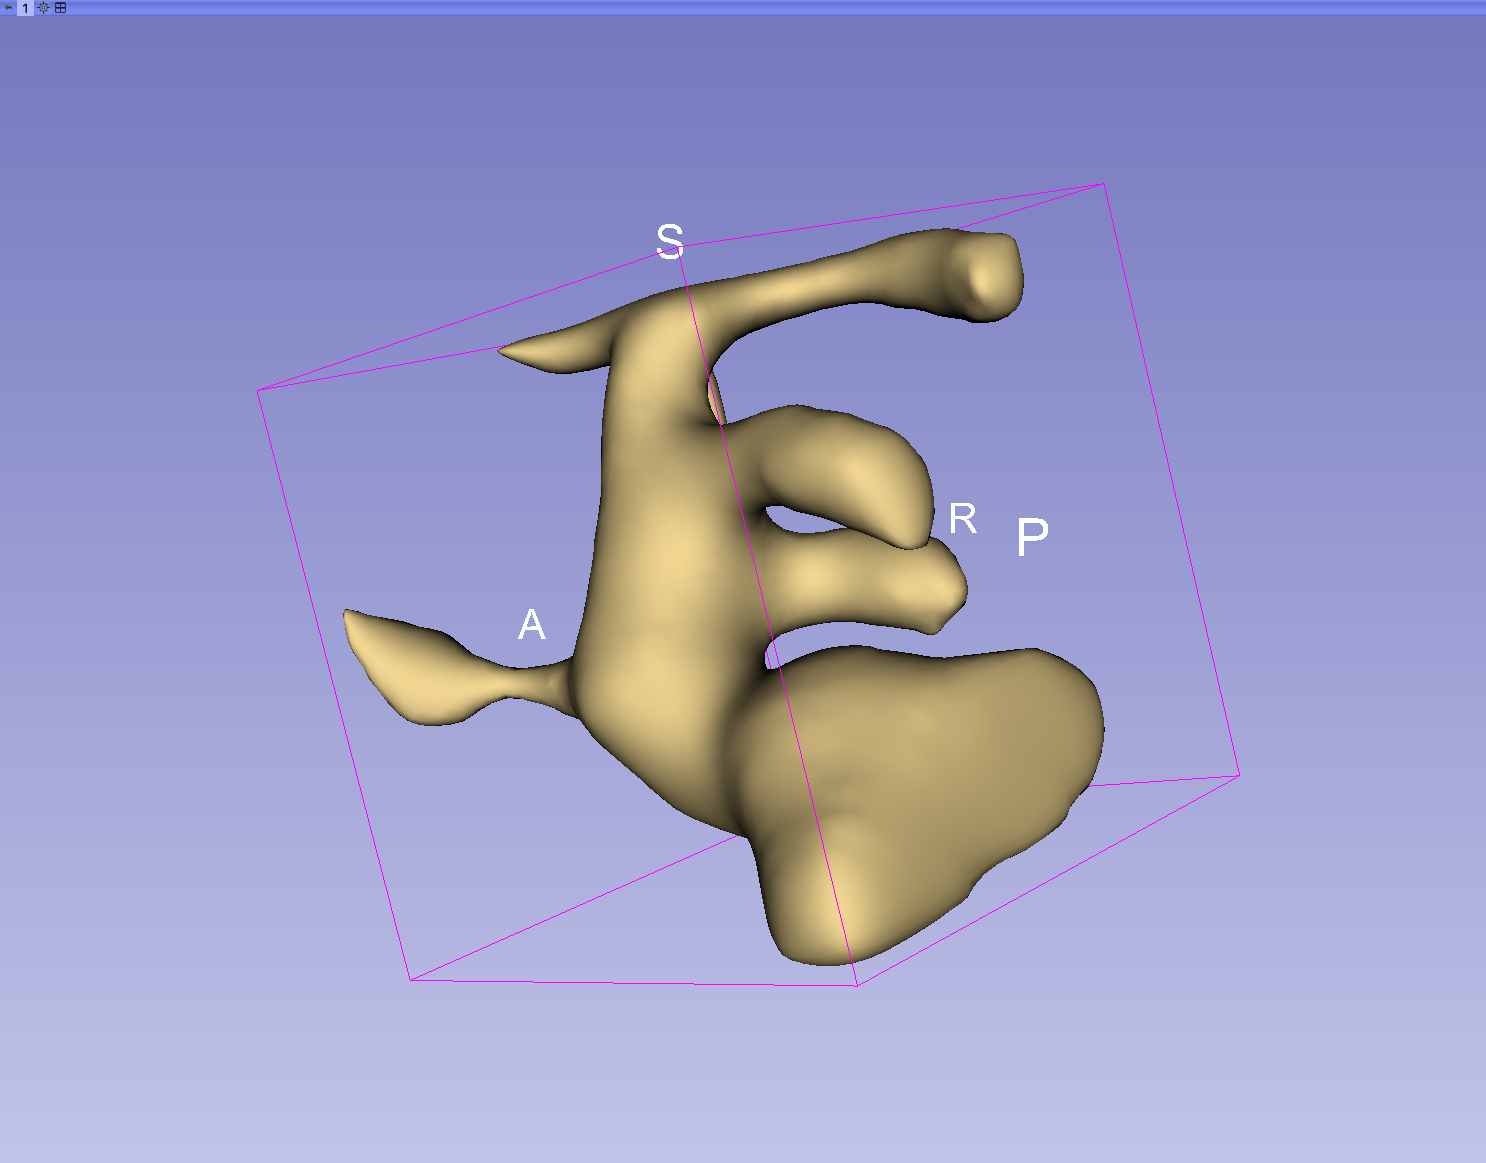
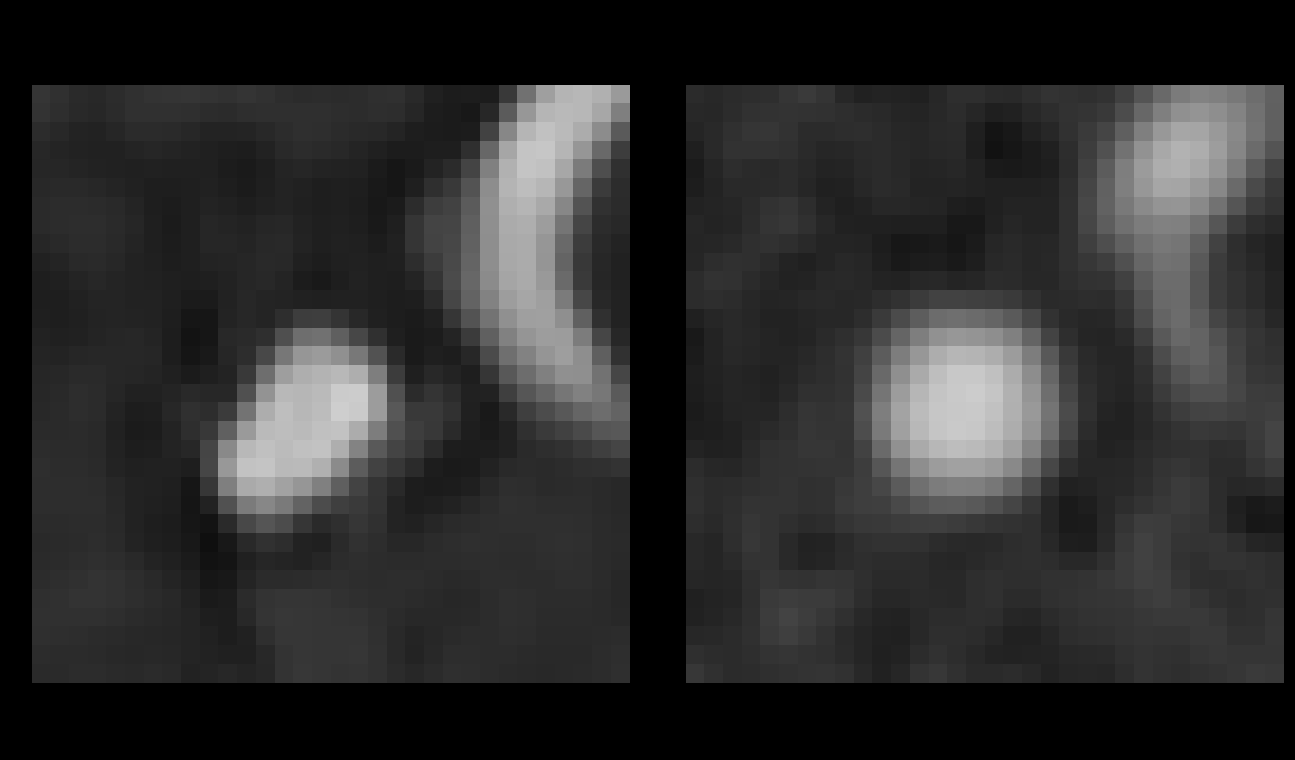
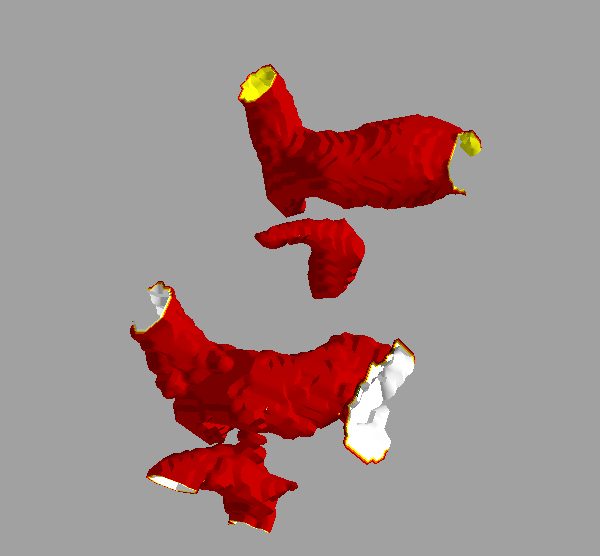
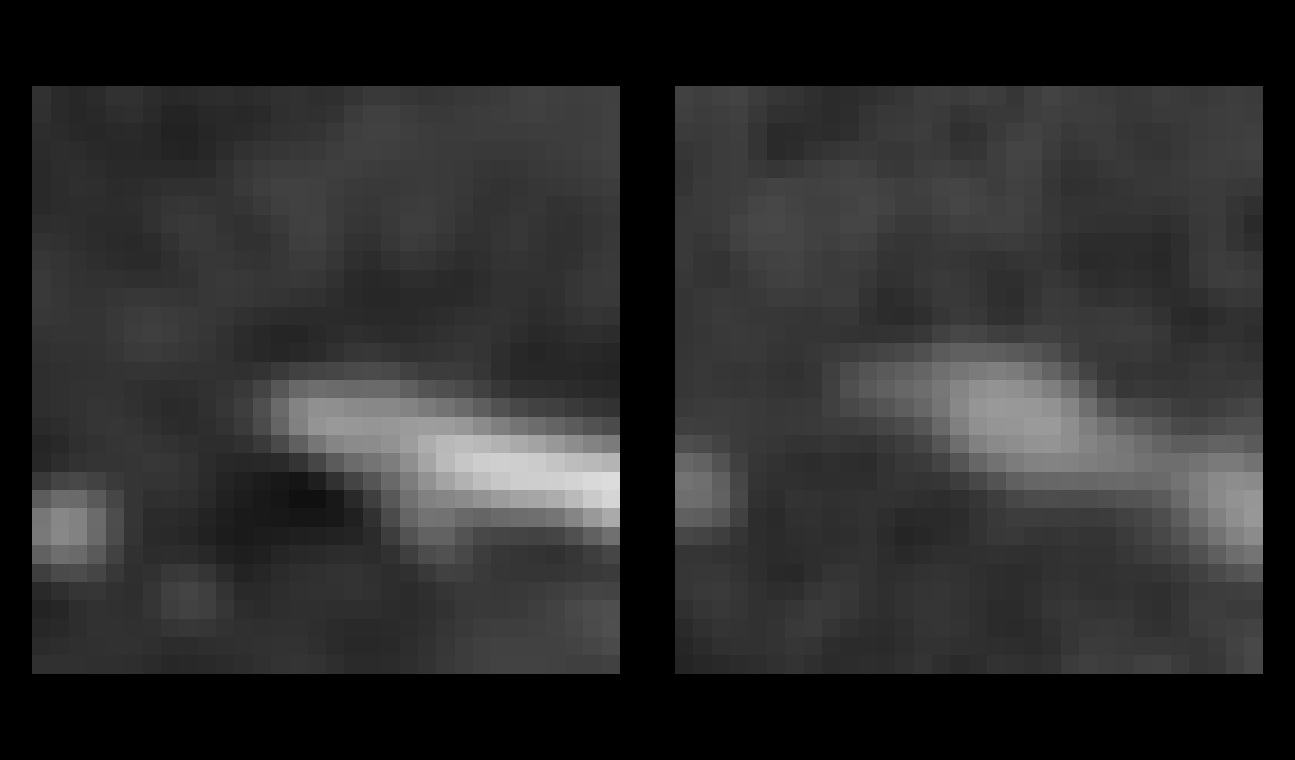
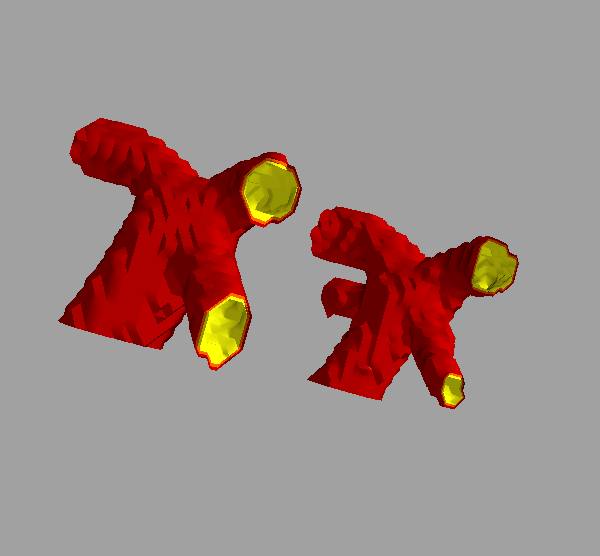
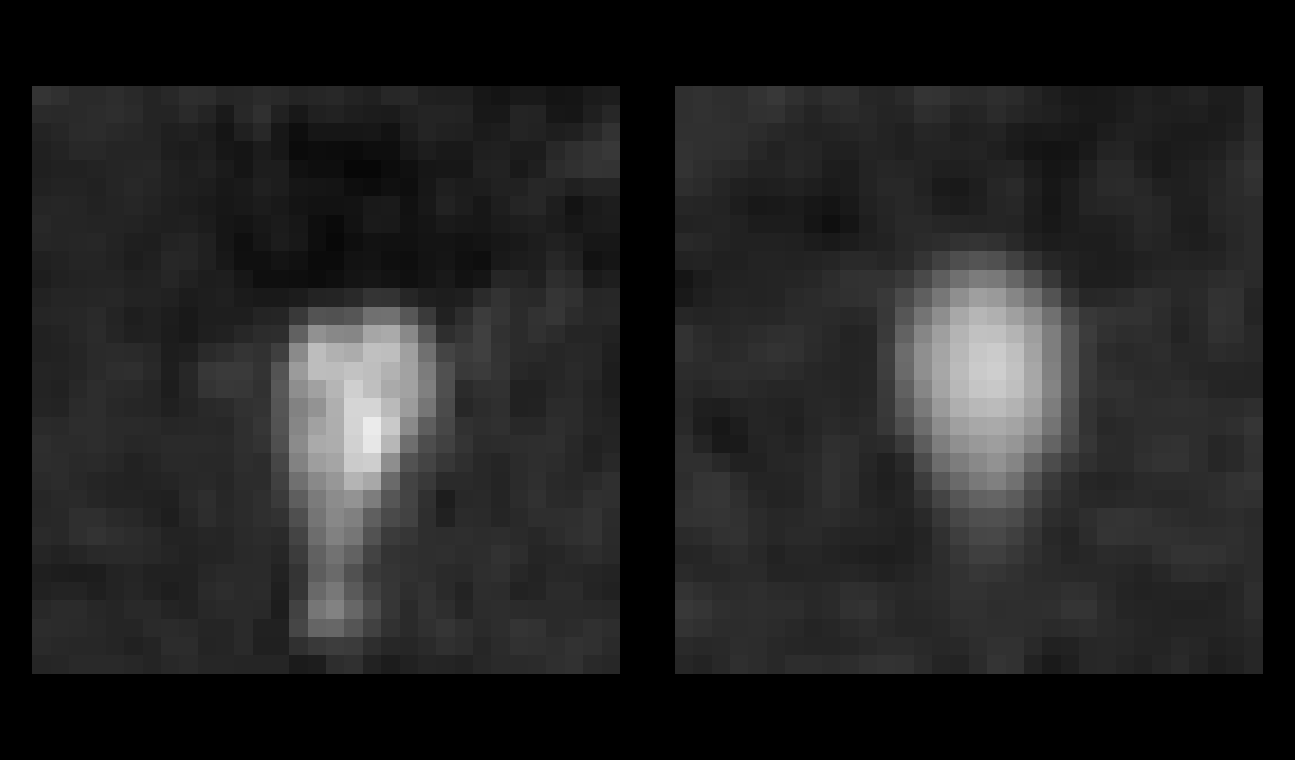
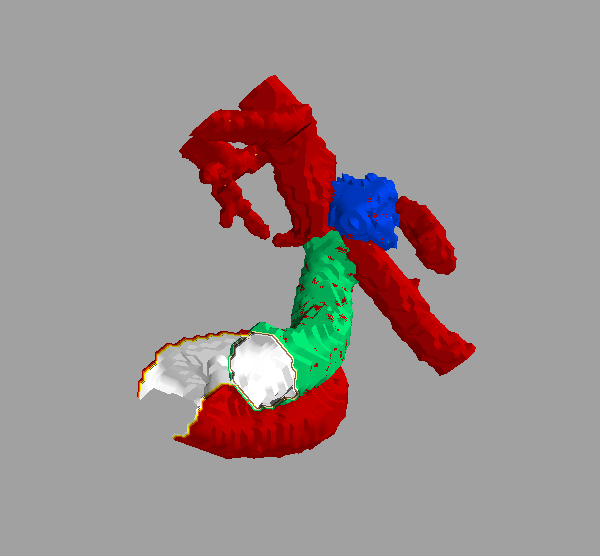
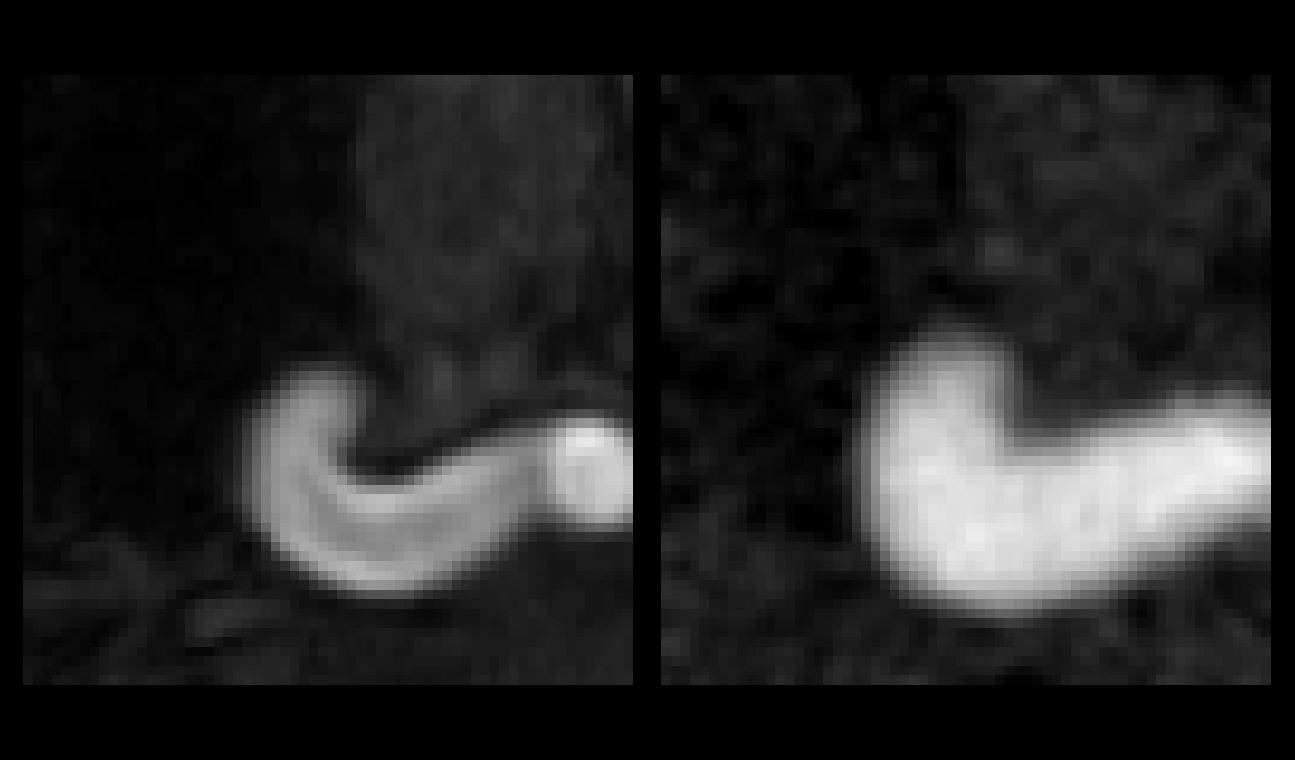
These geometric features are then
used by the vascular model to mimic the arterial tree and
moreover, some statistical properties of the background noise are
also modeled.
The final goal of this model being to generate
a significant amount of images for the training step of
Convolutional Neural Networks, we first need to come up with a
ground truth dataset. We have constituted a full image dataset
including several areas.
Using
3D Slicer, we have manually segmented 300
MRA-TOF images. Both the vascular tree, and the aneurysm (if any)
were segmented. Moreover, we have also positioned Fiducials (or
Markups) onto the 15 bifurcations of interest.
The figure below
shows at the same time, the vascular tree segmentation (depicted in
green), the aneurysm (in yellow) and the 15 bifurcations of interest
(fiducials in red).
Thanks to this "Ground Truth" dataset, we can
then run our vascular model on the 300 TOFs and thus generate tens
of thousands of distorted versions of various portions of the MRA
TOF images.
The synthetic Vascular Model operates as
follows :
The upper branch
of this schematic representation shows how we model the background
noises (white/gray matters, cerebrospinal fluid, lateral ventricles,
etc.), whereas the arterial tree modeling is depicted in the lower
branch.
The noise modeling
is relatively simple, we first generate some high frequency Gaussian
noise, which will later on go through a Gaussian filter of specific
properties, so as to end up having similar noise as our MRA-TOF
target. The maths behind the noise generation process are summarized
here.
Concerning the
modulation of the bifurcation geometry,
this figure shows how altering the spline
coefficients can help to tweak the arteries' tortuosity.
The figure below
shows how the branches can be modified from the actual bifurcation
(left images) to the modeled version (center images). The images in
the right panels show the superimposition of both versions.
Some results :
The images below show some 2D slices along
with the 3D representation of both bifurcations.
The 2D slices are represented on the left
column of the figure, the ground truth TOF patches (GT) are depicted
on the left, and their modeled versions are on the right.
As for the 3D representations (right column),
the GT arteries are filled in white, whereas the modeled arteries
are filled with yellow.
We can observe that both the arteries' shape
and the background noise are very accurately modeled.
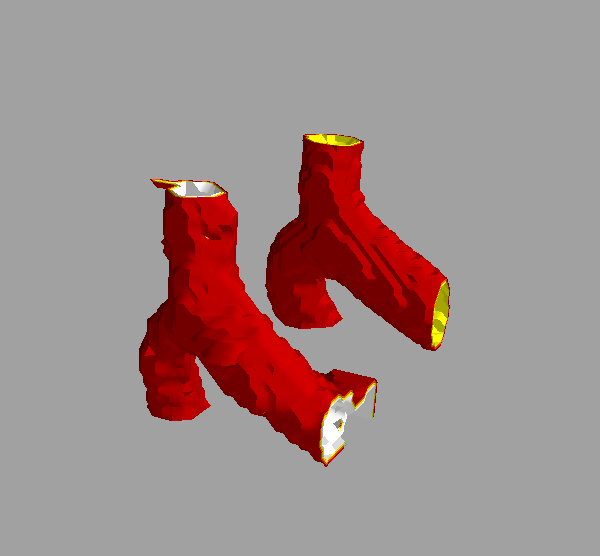
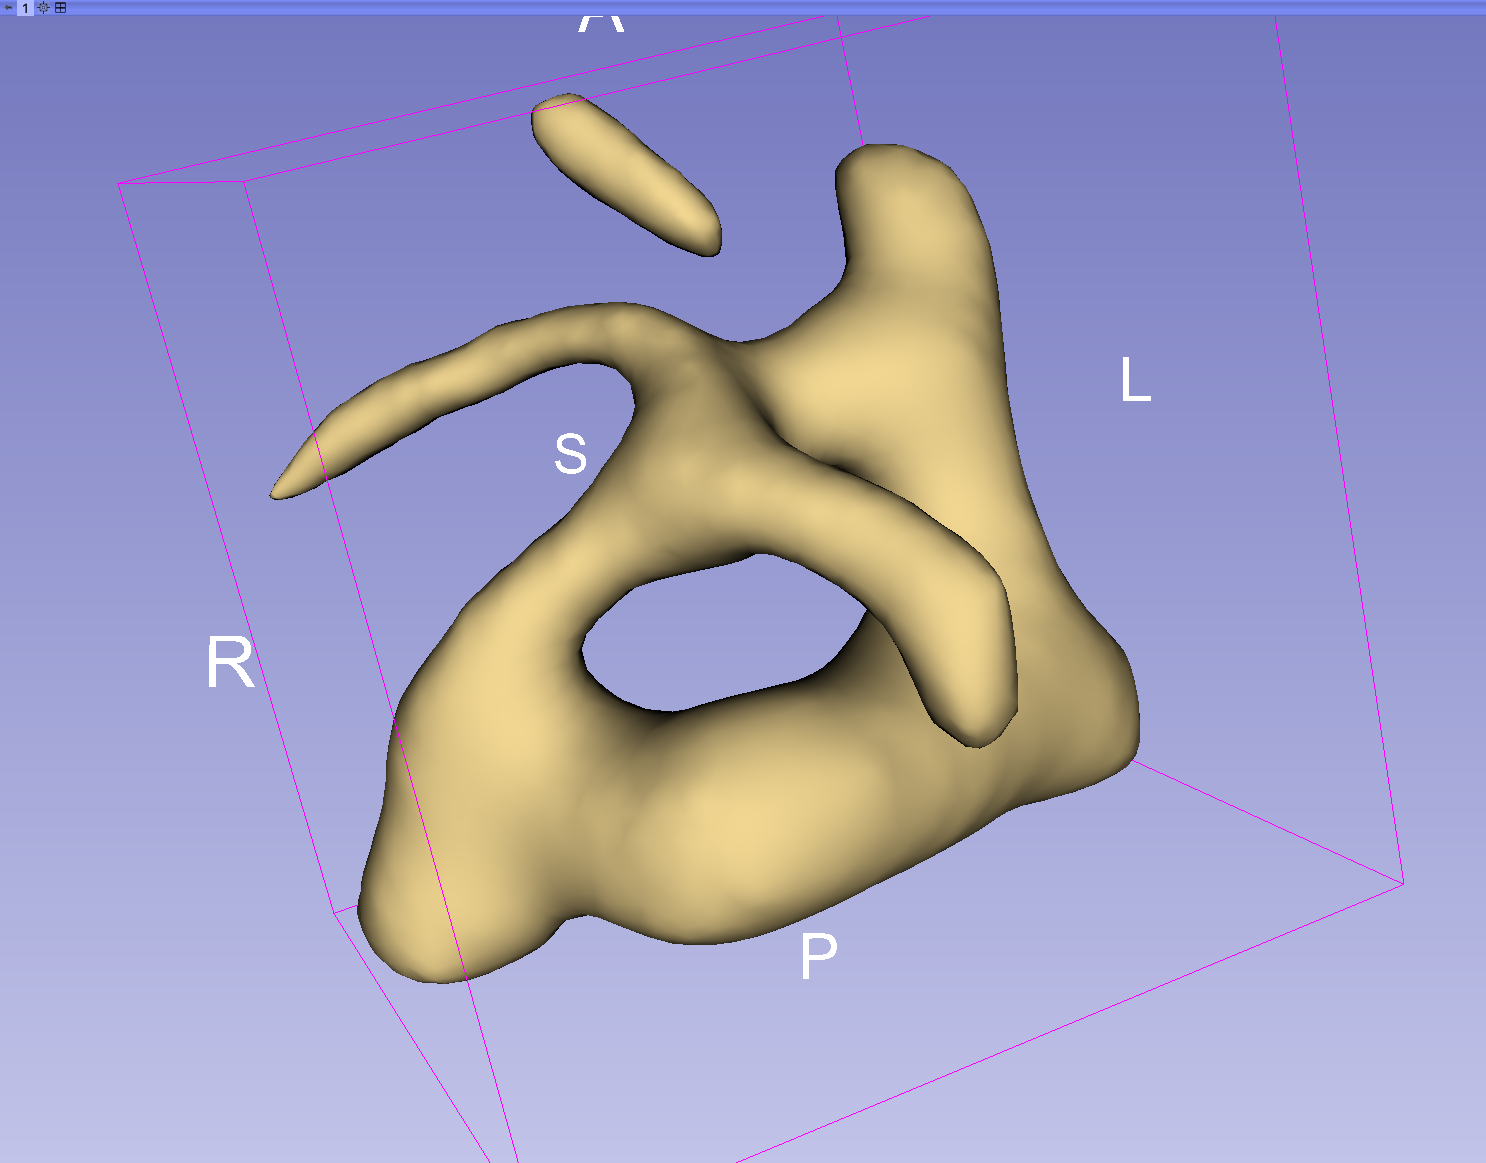
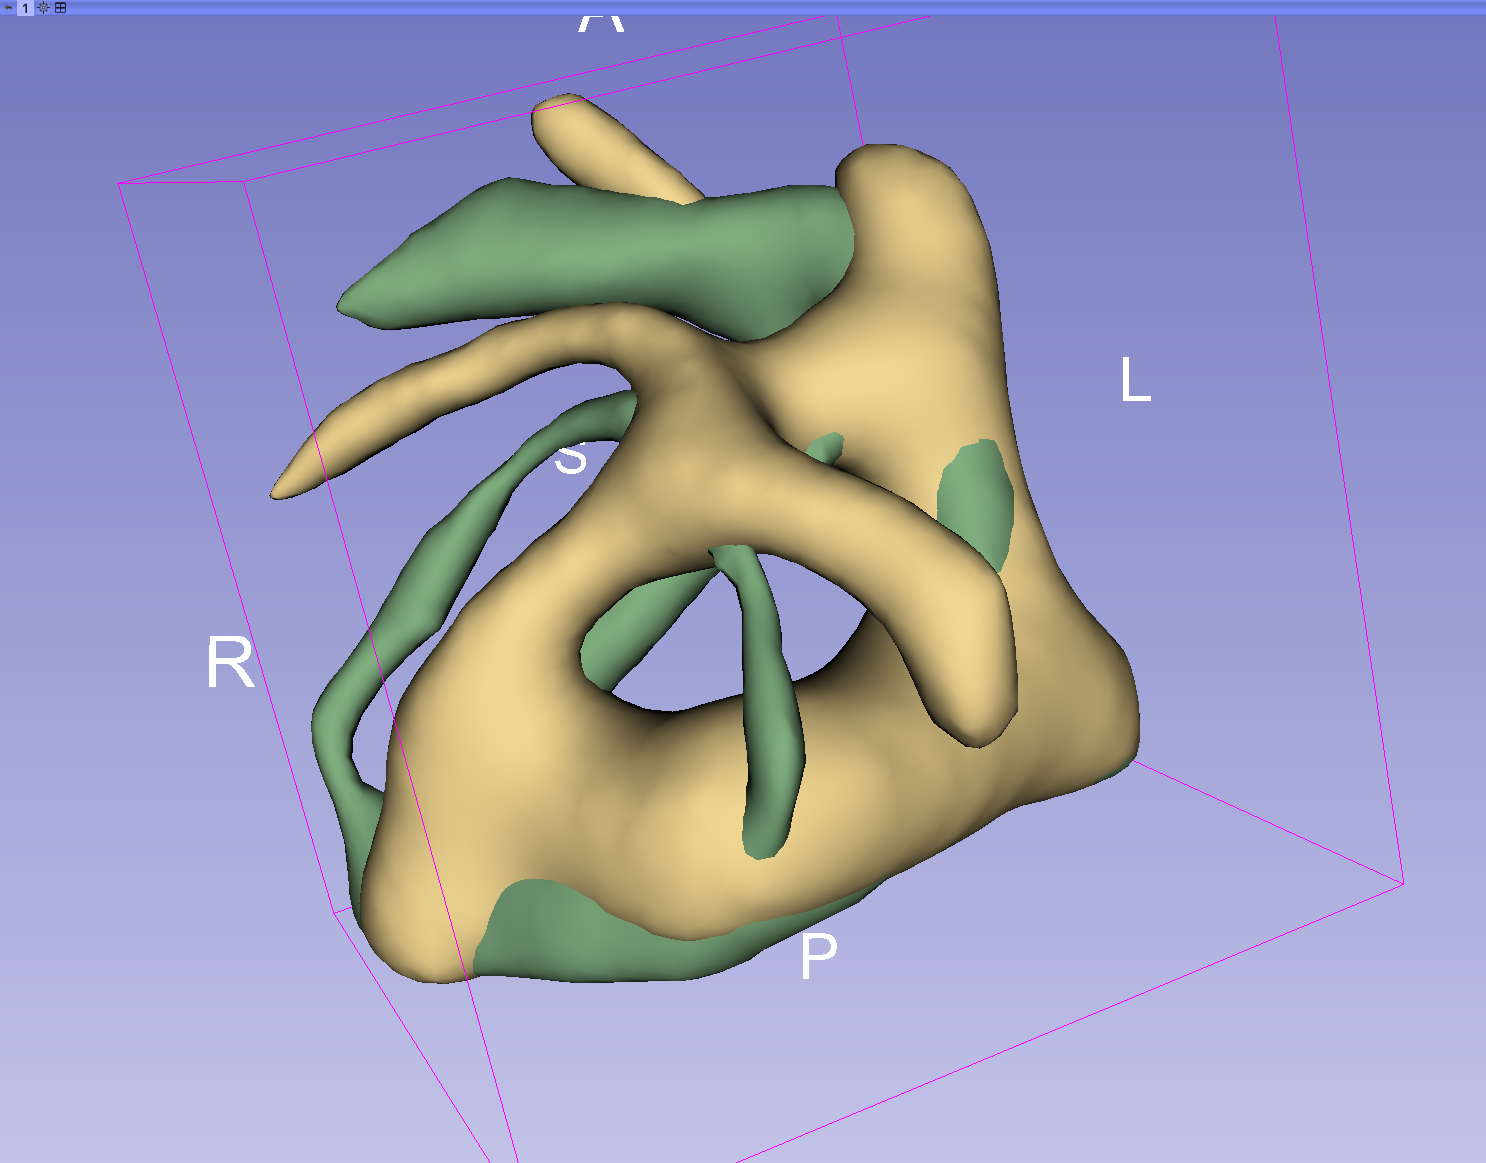
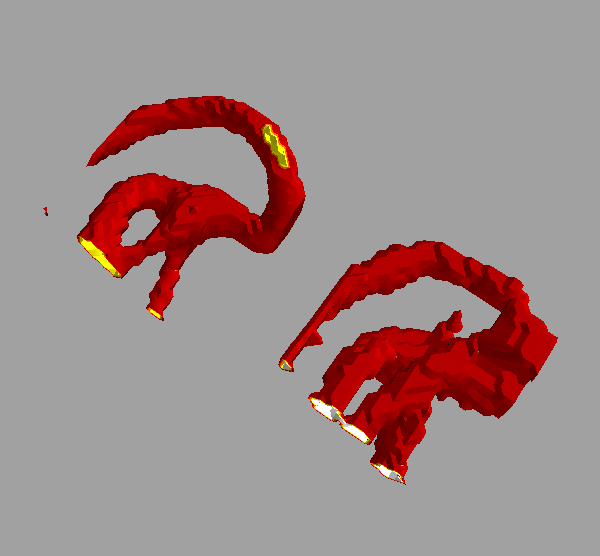
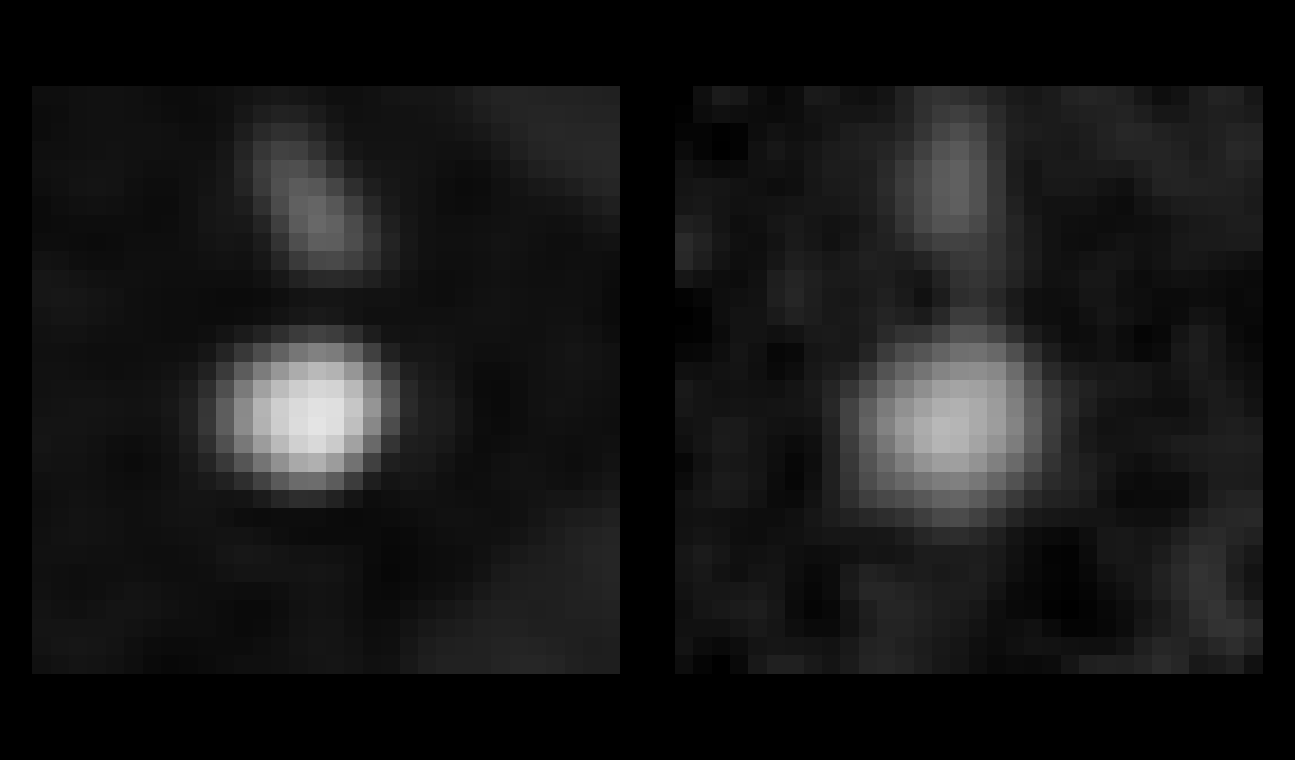
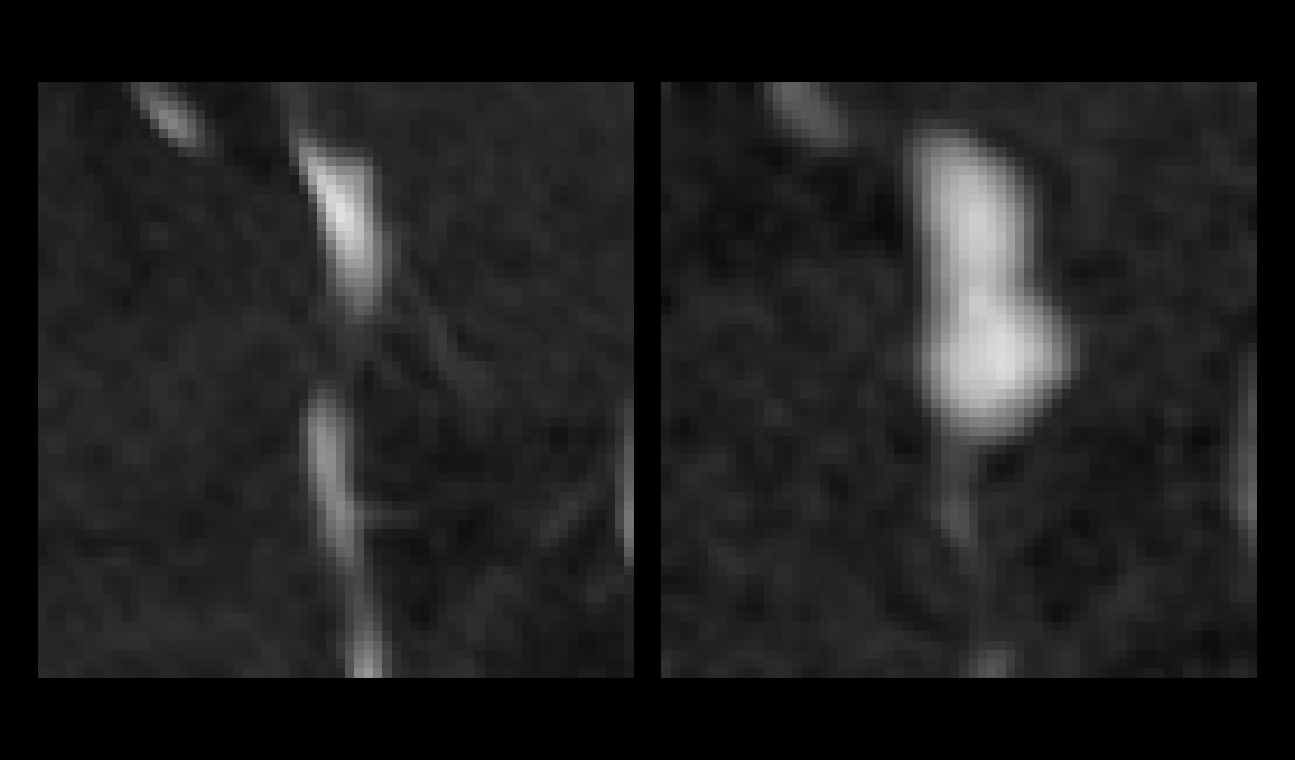
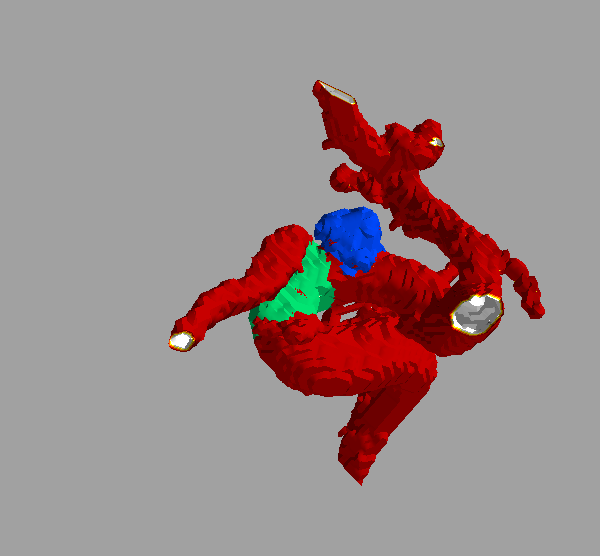
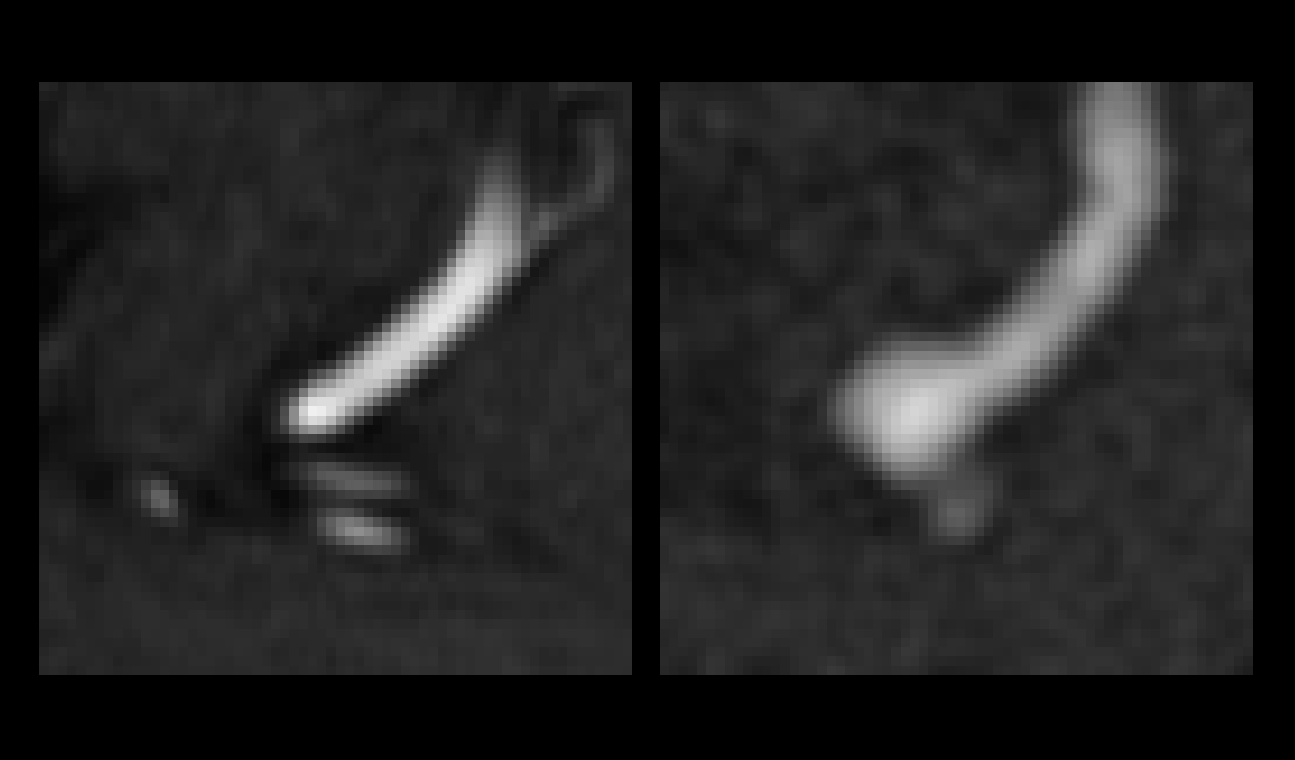
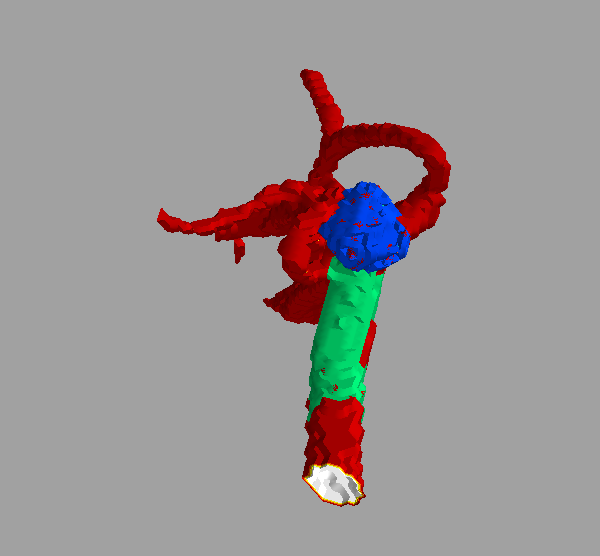
Finally, our model also allows to include an aneurysm in between the
two daughter arteries (See figures below).
Evidently, once an aneurysm has been
detected, it goes through a full characterization step, i.e. we
compute its bounding box, its volume, the elongation and flatness
coefficients, the neck surface and a sphericity index (see
this example).
The aneurysm is placed at distance D from the bifurcation center,
such that :
r is the aneurysm radius, R is the average radius of the branches
forming the bifurcation, and Θ stands for the angle formed by the two
daughter arteries. This equation allows to automatically adjust the
shift from the aneurysm center and the vessel wall where the daughter
arteries split.